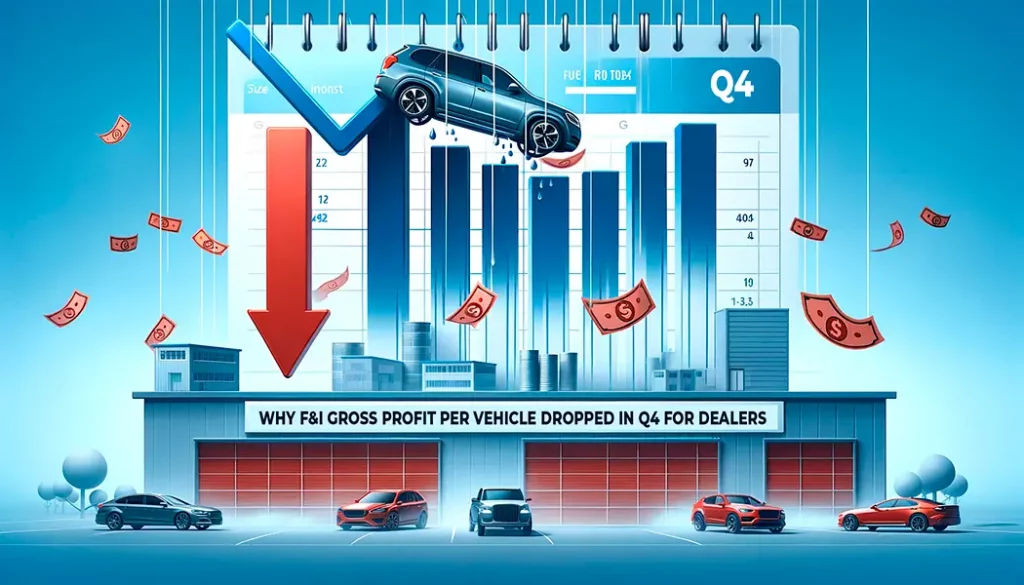
As the last leaves fell in the autumn of 2023, so did the F&I gross profit per vehicle for the majority of public dealership groups. It was a quarter that many in the automotive industry watched closely, as whispers of change turned into tangible outcomes.
But what caused this shift in one of the dealership’s most significant profit centers? Let’s take a closer look, weaving through the numbers and narratives that painted Q4 2023 in a unique hue.

Why F&I Gross Profit Per Vehicle Dropped in Q4 for Dealers (PDF)
Q4 2023: A Closer Look at F&I Gross Profit Trends
Public dealership groups faced a challenging Q4 in 2023, with the same-store finance and insurance (F&I) gross profit per vehicle taking a dip for four out of the six major players.
Despite this, F&I managed to grow as a percentage of dealership same-store gross profit, showing a silver lining in the cloud. The table below provides a snapshot of the landscape:
| Public Dealership Groups’ Q4 2023 F&I Earnings Results | ||||
|---|---|---|---|---|
| Q4 2023 | Q4 2022 | Dollar Change from 2022 | Percent Change from 2022 | |
| Asbury Automotive Group | ||||
| Avg. F&I gross profit per vehicle retailed | $2,295 | $2,621 | -$326 | −12.0% |
| F&I percentage of revenue | 4.5% | 5.2% | ||
| F&I percentage of gross profit | 24% | 25% | ||
| AutoNation | ||||
| Avg. F&I gross profit per vehicle retailed | $2,696 | $2,703 | -$7 | −0.3% |
| F&I percentage of revenue | 5.1% | 5.2% | ||
| F&I percentage of gross profit | 28% | 27% | ||
| Group 1 Automotive* | ||||
| Avg. F&I gross profit per vehicle retailed | $2,342 | $2,384 | -$42 | −1.8% |
| F&I percentage of revenue | 4.6% | 4.7% | ||
| F&I percentage of gross profit | 27% | 25% | ||
| Lithia Motors* | ||||
| Avg. F&I gross profit per vehicle retailed | $2,152 | $2,147 | $5 | 0.2% |
| F&I percentage of revenue | 4.6% | 4.5% | ||
| F&I percentage of gross profit | 28% | 26% | ||
| Penske Automotive Group* | ||||
| Avg. F&I gross profit per vehicle retailed | $1,897 | $1,866 | $31 | 1.7% |
| F&I percentage of revenue | 3.4% | 3.4% | ||
| F&I percentage of gross profit | 21% | 20% | ||
| Sonic Automotive Group | ||||
| Avg. F&I gross profit per vehicle retailed | $2,334 | $2,396 | -$62 | −2.6% |
| F&I percentage of revenue | 4.1% | 4.2% | ||
| F&I percentage of gross profit | 25% | 24% | ||
What Led to the Decline?
The narrative behind these numbers is multifaceted, reflecting broader economic currents and industry-specific challenges. Interest rates, a crucial influencer of F&I profits, emerged as a central theme. The tightening grip of higher rates not only strained consumer wallets but also made the affordability of monthly payments more challenging, as highlighted by Asbury Automotive Group’s COO Dan Clara.
This era also witnessed a shift in leasing strategies. Leasing, traditionally a less fertile ground for F&I product sales, saw a dip in penetration from the pre-pandemic highs. The rebound in leasing in 2023, however, was not enough to offset the pressures on F&I profits. The industry’s pivot toward digital sales and direct financing offers added another layer of competition, further squeezing margins.
Yet, amidst this narrative of challenge, there was resilience. AutoNation barely felt the sting with a marginal drop, illustrating the variance in how each dealer group navigated the headwinds. Strategies to counteract these pressures included expanding F&I product offerings, as seen with Asbury’s Total Care Auto, and focusing on improving leasing sales, as indicated by AutoNation’s increase in leasing to 23 percent of new-vehicle sales.
The dealerships’ adaptability and strategic shifts underline a broader theme: the relentless pursuit of maintaining profitability amidst evolving market dynamics. As we reflect on these Q4 outcomes, the question arises: what innovative strategies will dealers adopt next in the face of ongoing financial pressures? Will the focus on digital platforms and direct-to-consumer financing become the new battleground for F&I profits, or will traditional methods find new life in adaptation?
As the automotive industry steers into 2024, the journey promises to be as much about innovation as it is about adaptation. With the landscape ever-changing, one wonders, what’s next on the horizon for F&I gross profits?


