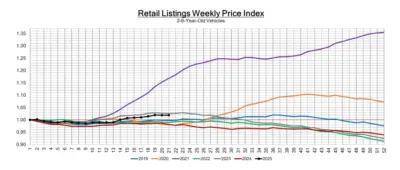
This image displays a line graph showing the “Retail Listings Weekly Price Index” specifically for 3-5 year-old vehicles. It charts weekly price movements across different years (2019-2025), providing valuable insights for market analysis, used car valuation, and trend identification.
Get a Free Claim Review
Wondering how much your vehicle lost in Value? Click the button to know more.
-
1372 Peachtree St NE
Ste S10
Atlanta, GA 30309 - (678) 404-0455
- (678) 868-1832
About us
Diminished Value of Georgia is powered by Appraisal Engine Inc™ | All Rights Reserved.

