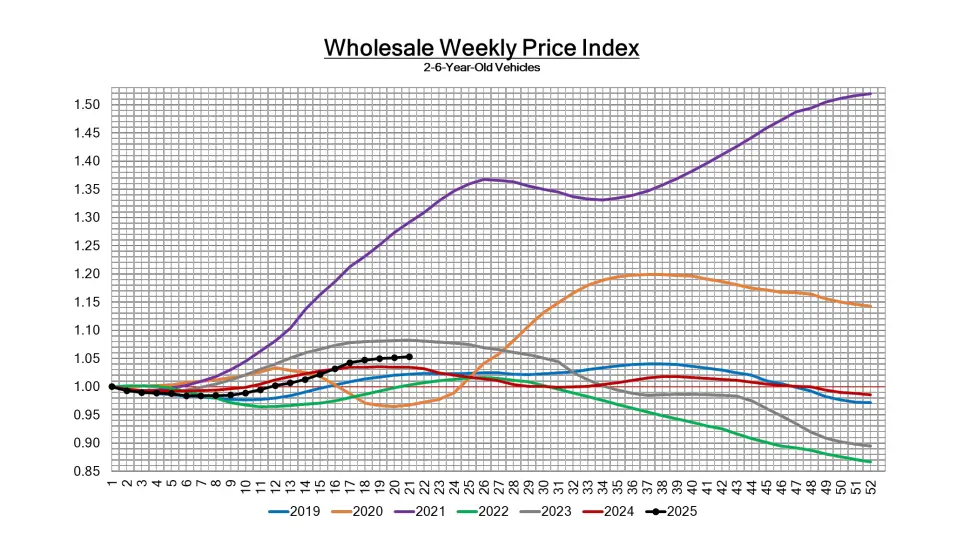
This image features a “Wholesale Weekly Price Index” line graph specifically for 2-8 year old vehicles, detailing price trends annually from 2019 to 2025 over a 6-year period. It’s an essential visual for automotive market analysis, used car valuation, and historical price comparisons.