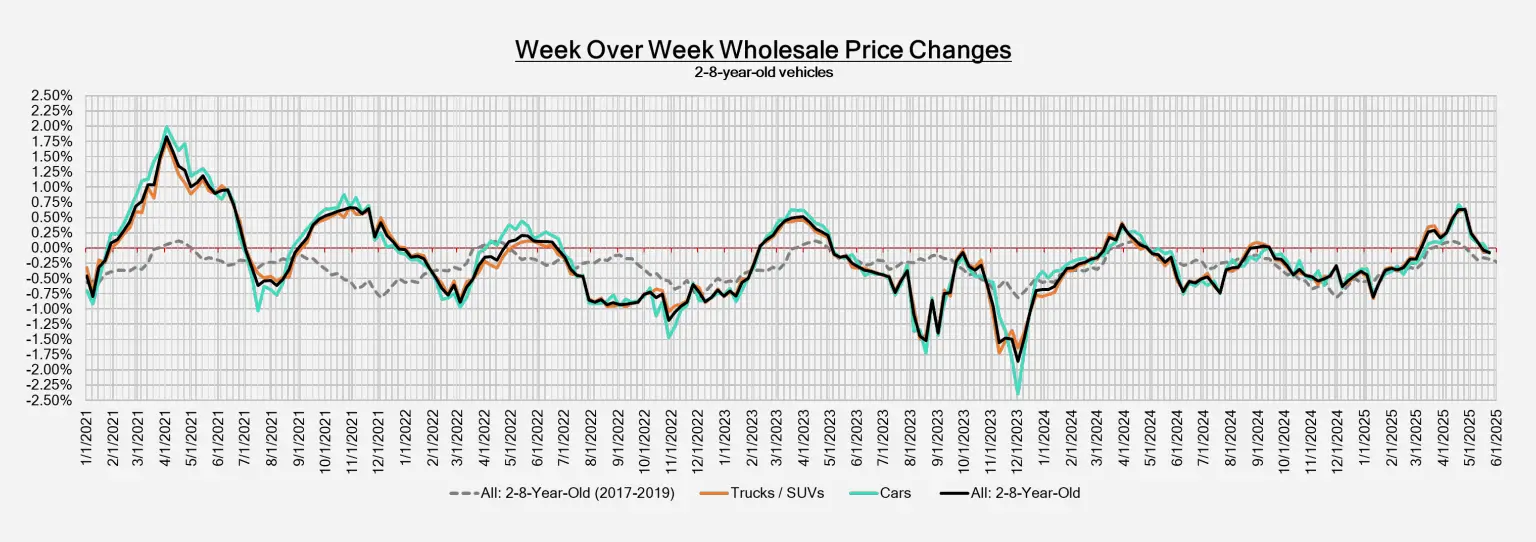
This image displays a line graph detailing “Week Over Week Wholesale Price Changes” for 2-8 year old vehicles. It provides a comparative analysis of price trends for the overall used vehicle market, specifically breaking down data for trucks & SUVs, and cars.