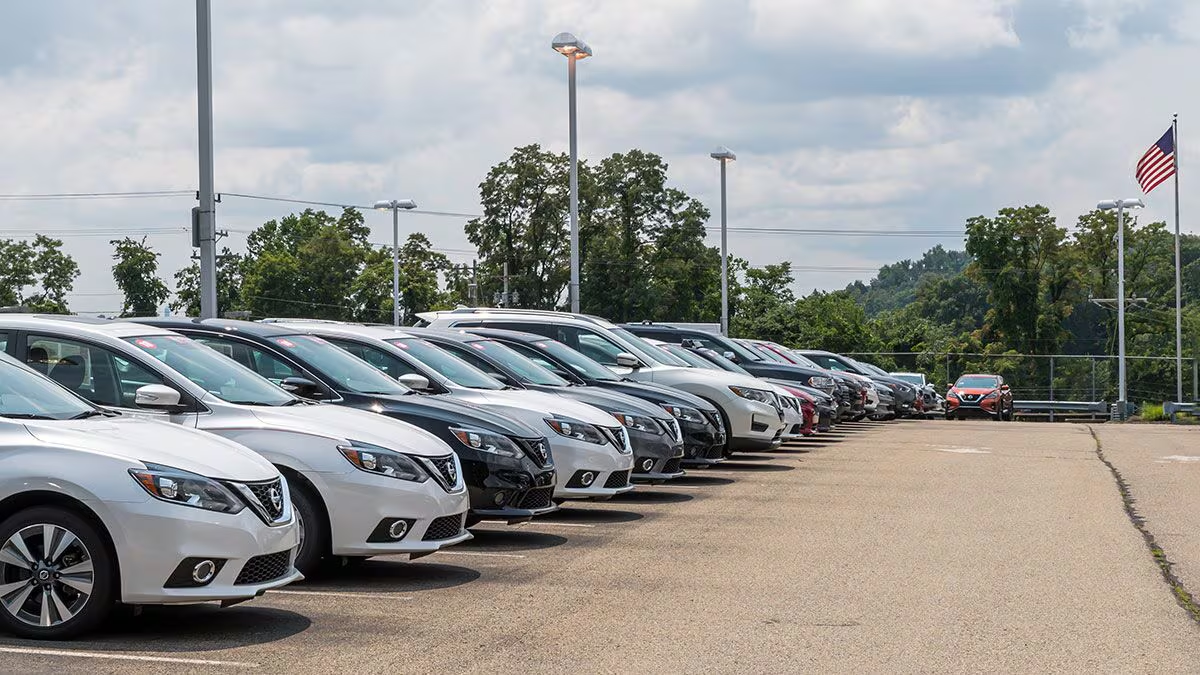
Top 25 Dealership Groups Based in the U.S – 2016
| 2015 rank |
Dealership group name | Total new retail units |
Total used units |
Total units |
Total number of dealerships |
Group revenue all departments* |
2014 rank |
| 1 | AutoNation Inc.† | 339,080 | 227,290 | 644,164 | 254 | 20,862,000,000 | 1 |
| 2 | Penske Automotive Group Inc.†‡ | 233,524 | 198,459 | 523,759 | 263 | 19,285,000,000 | 2 |
| 3 | Group 1 Automotive Inc.†‡ | 174,614 | 124,153 | 355,993 | 152 | 10,632,505,000 | 3 |
| 4 | Sonic Automotive Inc.† | 138,129 | 117,123 | 287,292 | 99 | 9,624,340,405 | 5 |
| 5 | Lithia Motors Inc.† | 137,486 | 99,109 | 278,151 | 137 | 7,864,251,691 | 8 |
| 6 | Hendrick Automotive Group | 116,831 | 81,628 | 258,194 | 101 | 7,931,836,862 | 6 |
| 7 | Asbury Automotive Group Inc.† | 105,981 | 82,589 | 188,570 | 84 | 6,588,300,000 | 7 |
| 8 | Ken Garff Automotive Group | 71,703 | 39,813 | 143,240 | 50 | 4,108,869,431 | 10 |
| 9 | Staluppi Auto Group | 65,468 | 22,708 | 111,353 | 30 | 2,983,383,577 | 9 |
| 10 | Larry H. Miller Dealerships previously Larry H. Miller Group of Cos. |
62,476 | 48,995 | 165,228 | 55 | 4,439,997,260 | 11 |
| 11 | Greenway Automotive‡ | 48,236 | 27,185 | 97,115 | 50 | 2,254,177,905 | 12 |
| 12 | David Wilson Automotive Group‡ | 47,100 | 15,770 | 76,848 | 18 | 2,153,793,466 | 13 |
| 13 | Keyes Automotive Group | 40,344 | 15,641 | 64,376 | 15 | 2,137,727,707 | 14 |
| 14 | Jim Koons Automotive Cos. | 37,827 | 25,805 | 79,133 | 17 | 2,173,058,503 | 15 |
| 15 | Suburban Collection | 33,818 | 20,202 | 68,110 | 41 | 2,163,916,980 | 16 |
| 16 | Herb Chambers Cos. | 33,490 | 20,427 | 75,814 | 35 | 2,522,762,046 | 17 |
| 17 | Potamkin Automotive Group Inc. | 31,951 | 12,194 | 54,248 | 27 | 1,679,002,119 | 18 |
| 18 | CAR Group, The | 30,592 | 11,856 | 50,170 | 13 | 1,163,734,500 | 21 |
| 19 | Earnhardt Auto Centers | 29,922 | 14,074 | 57,142 | 21 | 1,457,325,907 | 20 |
| 20 | West-Herr Automotive Group Inc. | 28,500 | 17,986 | 69,354 | 25 | 1,673,016,822 | 24 |
| 21 | Serra Automotive Inc. | 27,500 | 24,090 | 59,659 | 39 | 1,612,095,434 | 19 |
| 22 | RML Automotive | 25,572 | 17,609 | 58,377 | 26 | 1,463,712,153 | 23 |
| 23 | Rick Case Automotive Group | 25,334 | 21,679 | 47,013 | 15 | 1,130,500,685 | 26 |
| 24 | Findlay Automotive Group | 25,321 | 14,619 | 51,536 | 28 | 1,533,002,040 | 22 |
| 25 | Fletcher Jones Automotive Group | 24,720 | 11,804 | 48,354 | 17 | 2,273,420,218 | 25 |


