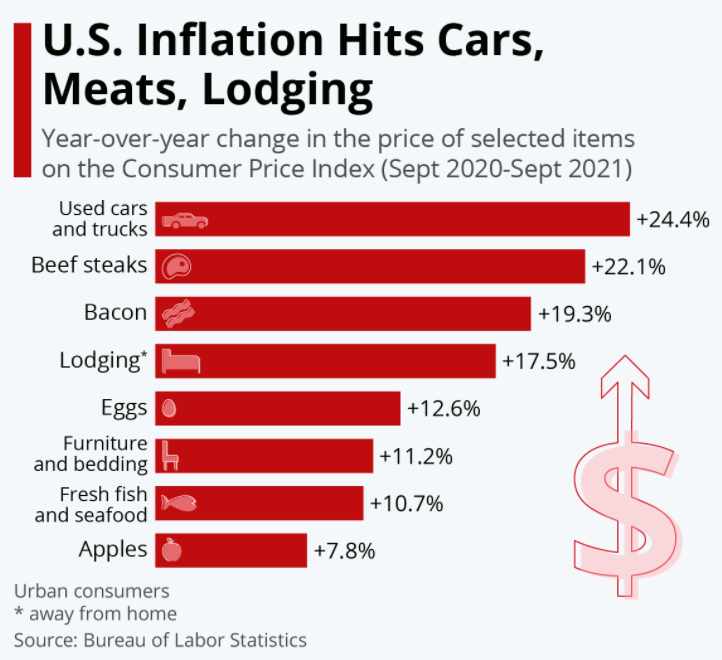
The price of used cars and trucks rose by almost a quarter between September 2020 and September 2021.
The index for all items less food and energy rose 4.0 percent over the past 12 months. The index for used cars and trucks increased 24.4 percent over the same time.

Used Price Change Index
The price used in the index is an estimated transaction price based on sales for the model over the past 30 days. Prices are collected for the base price, destination charge, options, dealer preparation charges, and applicable taxes. Averages are then estimated to adjust the price for markups, dealer concession or discounts, and consumer rebates. Finance charges are excluded from the price, and any incentives associated with low-interest financing are excluded from the discount or rebate amount.
| Seasonally adjusted price increase 2020 v 2021 | |
| All Items | 5.4 |
| Food | 4.6 |
| food at home | 4.5 |
| Food Away From Home (1) | 4.7 |
| Energy | 24.8 |
| Energy Commodities | 3 |
| Gasoline (All Types) | 42.1 |
| Fuel Oil (1) | 42.6 |
| Energy Services | 8 |
| Services | 20.6 |
| Energy | 4 |
| Energy Commodities | 5 |
| New Vehicles | 7 |
| Used Cars And Trucks | 24.4 |
| Commodities (1) | 2 |
| Services | 2.9 |
| Transportation Services 1 | 4.4 |
| Medical Care Services | 0.9 |


