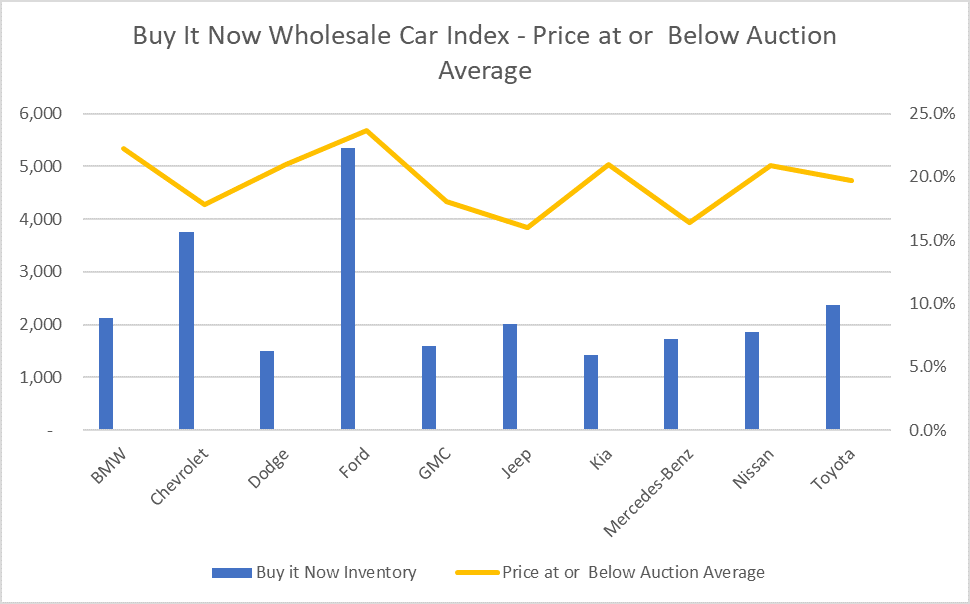
Below is a list of the top 10 auction cars sorted by how many are being sold Buy-it-Now and how the sale price relates to the auction average (MMR).
A: Price under 80% of Auction Average
B: Price at or Below Auction Average
C: Price above 120% of Auction Average
| Make | Total | A | B | C |
| BMW | 2,131 | 1.4% | 22.2% | 18.0% |
| Chevrolet | 3,748 | 1.7% | 17.8% | 16.0% |
| Dodge | 1,506 | 2.4% | 21.0% | 17.1% |
| Ford | 5,345 | 1.4% | 23.6% | 13.3% |
| GMC | 1,585 | 1.9% | 18.0% | 18.6% |
| Jeep | 2,003 | 1.6% | 16.0% | 11.2% |
| Kia | 1,420 | 1.9% | 21.0% | 13.9% |
| Mercedes-Benz | 1,726 | 1.5% | 16.4% | 18.8% |
| Nissan | 1,868 | 2.8% | 20.9% | 18.1% |
| Toyota | 2,375 | 2.0% | 19.7% | 17.5% |

- Make with most inventory for sale: Ford
- Make with highest percentage of vehicles with price over 120% of auction average: Mercedes-Benz
- Make with highest percentage of vehicles with price under 80% of auction average: Nissan
Buy It Now Wholesale Car Index


