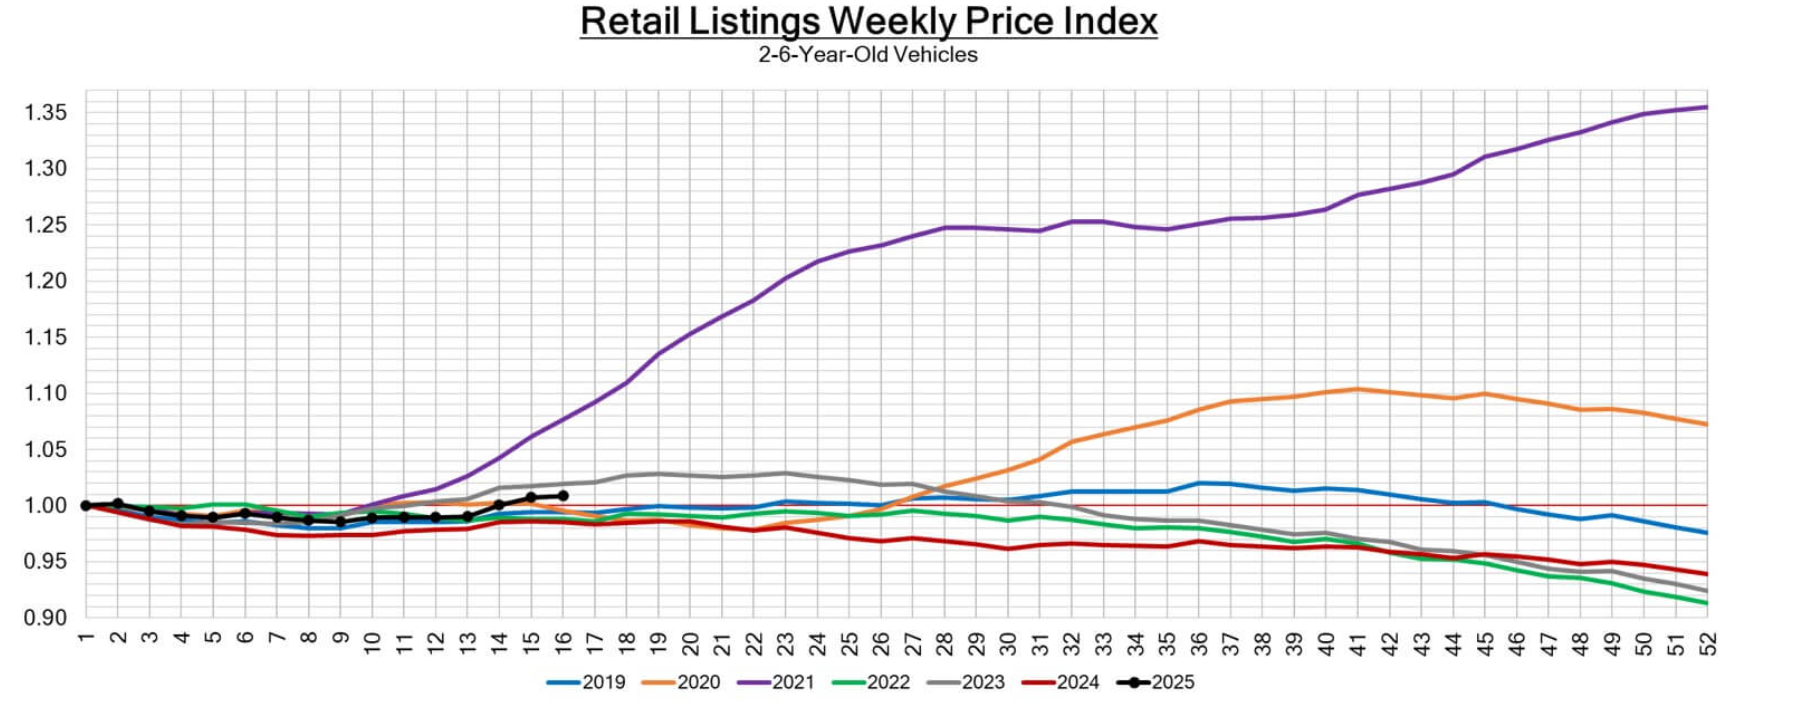
This image displays a line graph showing the “Retail Listings Weekly Price Index” specifically for 2-6 year-old vehicles. It charts weekly price movements across different years (2019-2025), providing valuable insights for market analysis, used car valuation, and trend identification.