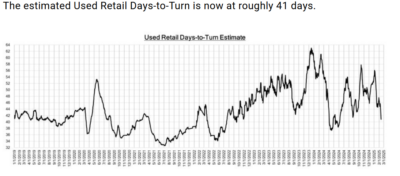
This image features a line graph illustrating the historical trend of “Used Retail Days-to-Turn Estimate,” depicting its fluctuations over time. A prominent text overlay updates this information to “roughly 41 days,” offering a current insight into market efficiency.
Get a Free Claim Review
Wondering how much your vehicle lost in Value? Click the button to know more.
-
1372 Peachtree St NE
Ste S10
Atlanta, GA 30309 - (678) 404-0455
- (678) 868-1832
About us
Diminished Value of Georgia is powered by Appraisal Engine Inc™ | All Rights Reserved.

