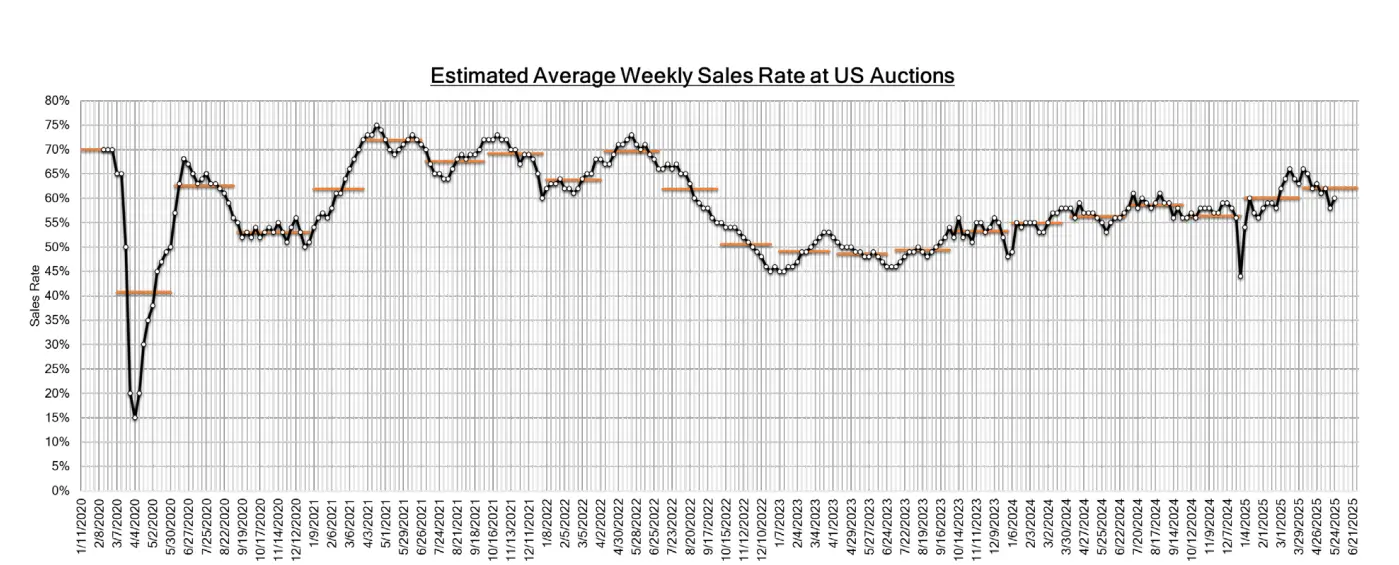
This image displays a detailed line graph titled “Estimated Average Weekly Sales Rate at US Auctions,” tracking historical weekly sales performance. It’s a valuable visual for analyzing trends in the used vehicle market, auction dynamics, and economic shifts impacting automotive sales in the US.