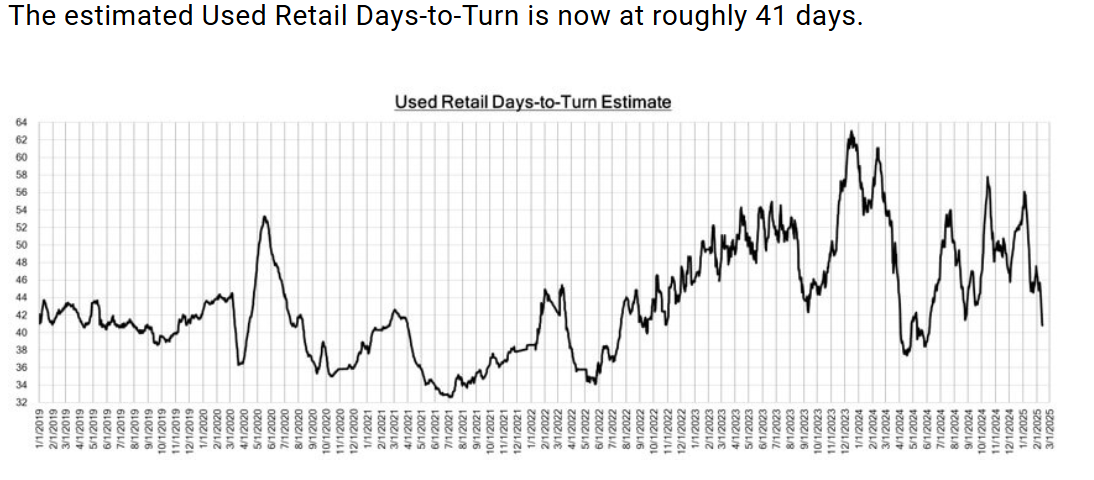
This image features a line graph illustrating the historical trend of “Used Retail Days-to-Turn Estimate,” depicting its fluctuations over time. A prominent text overlay updates this information to “roughly 41 days,” offering a current insight into market efficiency.