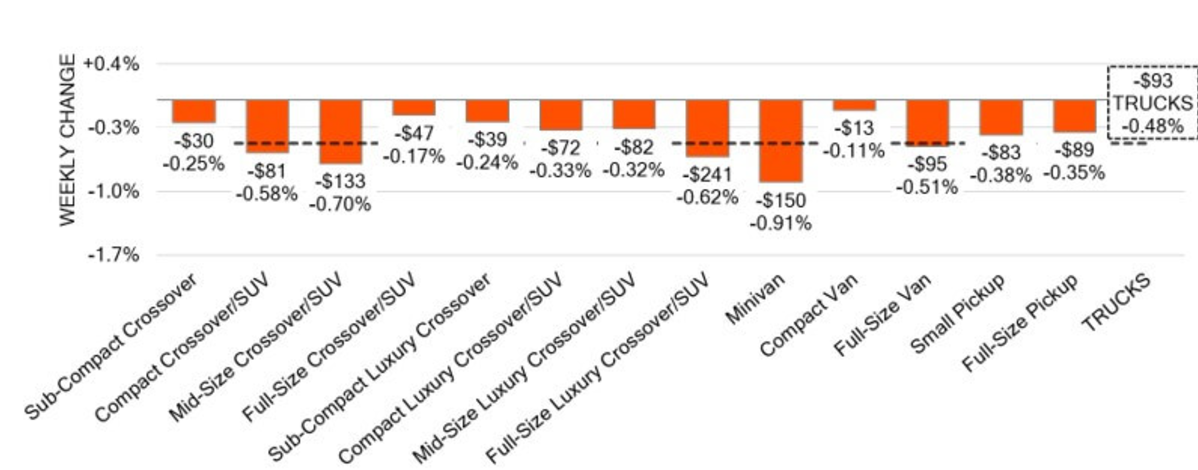
This image displays a bar chart detailing the “WEEKLY CHANGE” in value for different truck and SUV segments. It visually represents both the dollar and percentage fluctuations for categories such as various crossovers, minivans, and pickups, offering insight into market dynamics and a general downward trend.