Table of contents
The landscape of electric vehicles (EVs) in the United States is a fascinating blend of history, technology, market dynamics, and consumer attitudes. Let’s dive into this electrifying topic.

2024 Electric Vehicle Report – U.S. Sales and Registrations (PDF)
The Evolution and Growth of Electric Vehicles in the U.S.
Electric cars, a brainchild of the 19th century, have evolved significantly over time. The first electric car dates back to 1884, invented by Thomas Parker. However, EVs were overshadowed by petrol and diesel engines for a long time.
The modern era of EVs began with the GM EV1 in 1996 and gained momentum with Tesla’s introduction of the Roadster in 2008. Since 2010, annual sales of EVs in the U.S. have soared by an incredible 19,000%, highlighting a dramatic shift in the automotive landscape.
As of 2024, over 2 million EVs have been sold in the U.S., with California leading the charge, housing one-third of these sales. Despite this growth, EVs constitute only about 1% of all vehicles on American roads. The U.S. market for electric vehicles, while still nascent, is growing faster than any other vehicle market.
Interestingly, the best-selling EV in the U.S. is the Tesla Model Y, followed by the Tesla Model 3 and Ford Mustang Mach-E, with the Chevy Bolt EV/EUV ranking fourth.
Americans’ Views on Electric Vehicles
The perspective on electric vehicles (EVs) in the U.S. presents an intriguing blend of diverse opinions and age-related preferences. While over half of the American populace (51%) remains skeptical about a complete transition to electric vehicles, an impressive majority, roughly three-quarters, are open to the possibility of choosing an EV for their next car.
This openness is more pronounced among younger generations, with Millennials and Gen Z displaying a stronger preference for electric vehicles than their older counterparts. Nonetheless, there remains a palpable concern regarding the reliability and affordability of EVs.
About two-thirds of Americans acknowledge the environmental benefits of electric vehicles, yet a significant portion harbors reservations about their dependability and cost-effectiveness, often perceiving them as pricier alternatives to traditional gas-powered vehicles.
Read More: Are Electric Cars Reliable? Survey Findings Unveiled
Economic Aspects of EVs
On the economic front, EVs tend to be more expensive initially, with an average cost of over $56,000, about $10,000 more than the average gas-powered vehicle. However, they are cheaper to operate in the long run.
The average fuel cost for an EV is roughly $550 less than a gasoline vehicle and about $1150 less than a diesel vehicle. When considering the total cost of ownership over 200,000 miles, an EV could be more cost-effective by approximately $4,380 compared to a standard vehicle.
Electric Vehicle Market Share and Adoption
In 2023, Tesla led the EV market in the U.S., accounting for 56% of electric vehicle sales. However, Tesla’s dominance has been challenged by other automakers like Chevrolet and Ford, reflecting a diversifying market.
The U.S. market for EVs is expected to grow significantly, with EVs projected to account for 5.7% of all auto sales in 2023. This number is anticipated to rise to over 17% by 2028, signaling a trend toward mass adoption of electric vehicles.
How Many Electric Cars Are Registered in the U.S.?
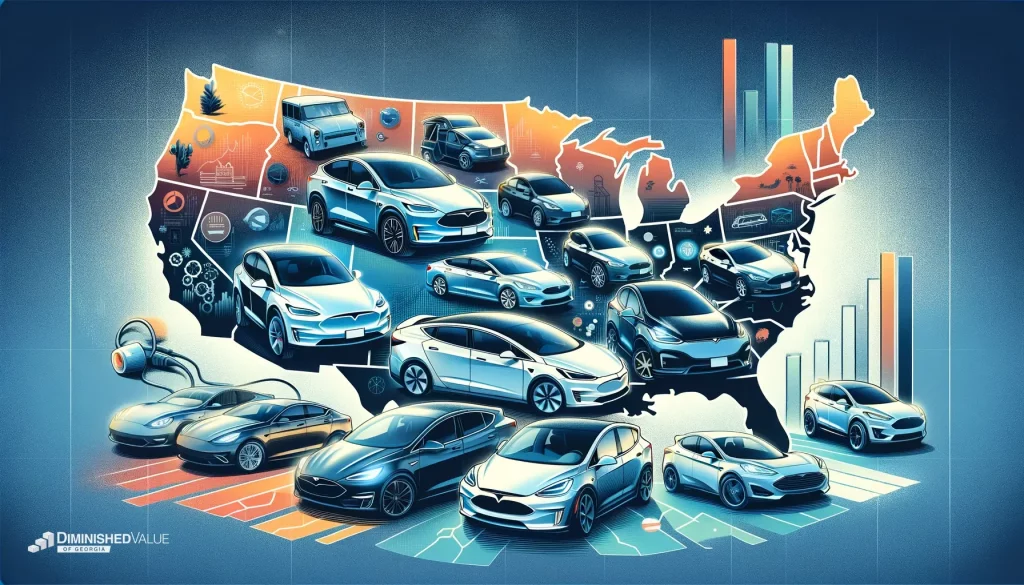
As of 2024, electric vehicle registrations in the U.S. show a clear picture of the adoption rate across different states:
- Total EV Registrations: Approximately 2.44 million, which is about 0.86% of all registered vehicles.
- Adoption Rates by State: A Varied Landscape:
- California stands at the forefront, boasting the highest adoption of electric vehicles.
- Other populous states such as Texas, Florida, and Washington also exhibit considerable adoption levels.
- In contrast, states with smaller populations or lower population densities tend to have fewer electric vehicles.
| EV Registrations by State | |
|---|---|
| State | Registration count |
| Alabama | 8,730 |
| Alaska | 1,970 |
| Arizona | 65,780 |
| Arkansas | 5,140 |
| California | 903,620 |
| Colorado | 59,910 |
| Connecticut | 22,030 |
| Delaware | 5,390 |
| District of Columbia | 5,860 |
| Florida | 167,990 |
| Georgia | 60,120 |
| Hawaii | 19,760 |
| Idaho | 5,940 |
| Illinois | 66,880 |
| Indiana | 17,710 |
| Iowa | 6,220 |
| Kansas | 7,550 |
| Kentucky | 7,560 |
| Louisiana | 5,880 |
| Maine | 4,990 |
| Maryland | 46,060 |
| Massachusetts | 49,440 |
| Michigan | 33,150 |
| Minnesota | 24,330 |
| Mississippi | 2,420 |
| Missouri | 17,870 |
| Montana | 3,260 |
| Nebraska | 4,570 |
| Nevada | 32,950 |
| New Hampshire | 6,990 |
| New Jersey | 87,030 |
| New Mexico | 7,080 |
| New York | 84,670 |
| North Carolina | 45,590 |
| North Dakota | 640 |
| Ohio | 34,060 |
| Oklahoma | 16,290 |
| Oregon | 46,980 |
| Pennsylvania | 47,440 |
| Rhode Island | 4,340 |
| South Carolina | 13,490 |
| South Dakota | 1,170 |
| Tennessee | 22,040 |
| Texas | 149,000 |
| Utah | 28,050 |
| Vermont | 5,260 |
| Virginia | 56,610 |
| Washington | 104,050 |
| West Virginia | 1,870 |
| Wisconsin | 15,700 |
| Wyoming | 840 |
| Total | 2,442,270 |
How Many Electric Cars Were Sold in the U.S.?
Electric vehicle sales in the U.S. have been growing rapidly. Here are some key statistics:
| Sales volume | EV | Hybrid | Plug-in hybrid | Internal combustion engine (ICE) |
|---|---|---|---|---|
| 2015 | 54,179 | 318,878 | 12,530 | 17,086,650 |
| 2016 | 70,466 | 346,816 | 16,984 | 17,124,945 |
| 2017 | 94,626 | 369,729 | 38,595 | 16,727,920 |
| 2018 | 206,365 | 430,421 | 54,519 | 16,620,333 |
| 2019 | 225,741 | 590,445 | 56,482 | 16,186,224 |
| 2020 | 233,330 | 577,803 | 38,658 | 13,705,565 |
| 2021 | 389,410 | 757,433 | 78,883 | 13,790,304 |
| 2022 | 713,145 | 754,772 | 113,743 | 12,200,411 |
| 2023 Jan-Nov | 976,555 | 1,172,841 | 147,655 | 11,812,464 |
Sales By Brand (First Three Quarters of 2023):
- Tesla: 493,513 units (56.53% market share)
- Chevrolet: 49,531 units (5.67%)
- Ford: 46,671 units (5.35%)
- Hyundai: 41,296 units (4.73%)
- Others: Various sales figures for brands like Audi, BMW, Nissan, etc
Global Perspective
Globally, the embrace of electric vehicles (EVs) varies significantly, with the Scandinavian countries, especially Norway, setting a leading example in EV adoption. This starkly contrasts with the United States, where less than 1% of vehicles in most states are electric, indicating a slower uptake.
Such disparity in EV adoption across countries is a reflection of differing national policies, economic incentives, and cultural attitudes toward green transportation and sustainable practices.
| The Best Selling EVs in 2023 Worldwide | ||
|---|---|---|
| Model | Country | Vehicles Sold (Jan-Aug 2023) |
| Tesla Model Y |  U.S. U.S. | 772,364 |
| Tesla Model 3 |  U.S. U.S. | 364,403 |
| BYD Atto 3 / Yuan Plus |  China China | 265,688 |
| BYD Dolphin |  China China | 222,825 |
| GAC Aion S |  China China | 160,693 |
| Wuling HongGuang Mini EV |  China China | 153,399 |
| GAC Aion Y |  China China | 136,619 |
| VW ID.4 |  Germany Germany | 120,154 |
| BYD Seagull |  China China | 95,202 |
Conclusion
The journey of electric vehicles in the U.S. is a story of innovation, resilience, and changing perceptions. From the early inventions of the 19th century to the modern surge led by companies like Tesla, the EV market in America is gradually carving out its niche. As we witness this evolution, one can’t help but wonder: will electric cars eventually become the new normal on American roads?


