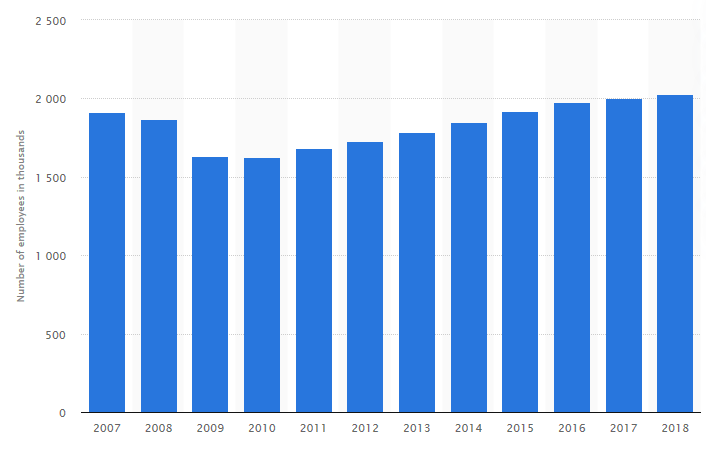
Below is a table outlining the number of employees in the U.S. motor vehicle and parts dealer industry from 2007 to 2018.
| Year | Employees x 1,000 | Y/Y Change |
| 2007 | 1,911 | |
| 2008 | 1,871 | -2.1% |
| 2009 | 1,634 | -12.7% |
| 2010 | 1,625 | -0.6% |
| 2011 | 1,685 | 3.7% |
| 2012 | 1,730 | 2.7% |
| 2013 | 1,782 | 3.0% |
| 2014 | 1,851 | 3.9% |
| 2015 | 1,921 | 3.8% |
| 2016 | 1,974 | 2.8% |
| 2017 | 2,004 | 1.5% |
| 2018 | 2,026 | 1.1% |
This statistic represents the number of employees in the motor vehicle and parts dealer industry in the United States between 2007 and 2018.
As of Q2 2018 approximately 2 million people were employed by businesses in the auto dealer industry.


