June 2018 Auto Auction Report:
Auto Auction Statistics – June 2018 Report (PDF)
Data for Auto Auction Statistics – June 2018 Report (Raw Data – PDF)
Data Analysis of auction vehicle inventory in the United States for June 2018.
We inventoried and analyzed 158,416 vehicles offered for sale at car auctions throughout the US, below are our findings.
Categories:
- Inventory by State
- Inventory by Make and Model
- Inventory by Color
- Inventory by Source
- Inventory by Model Year
- Inventory by Vehicle Type
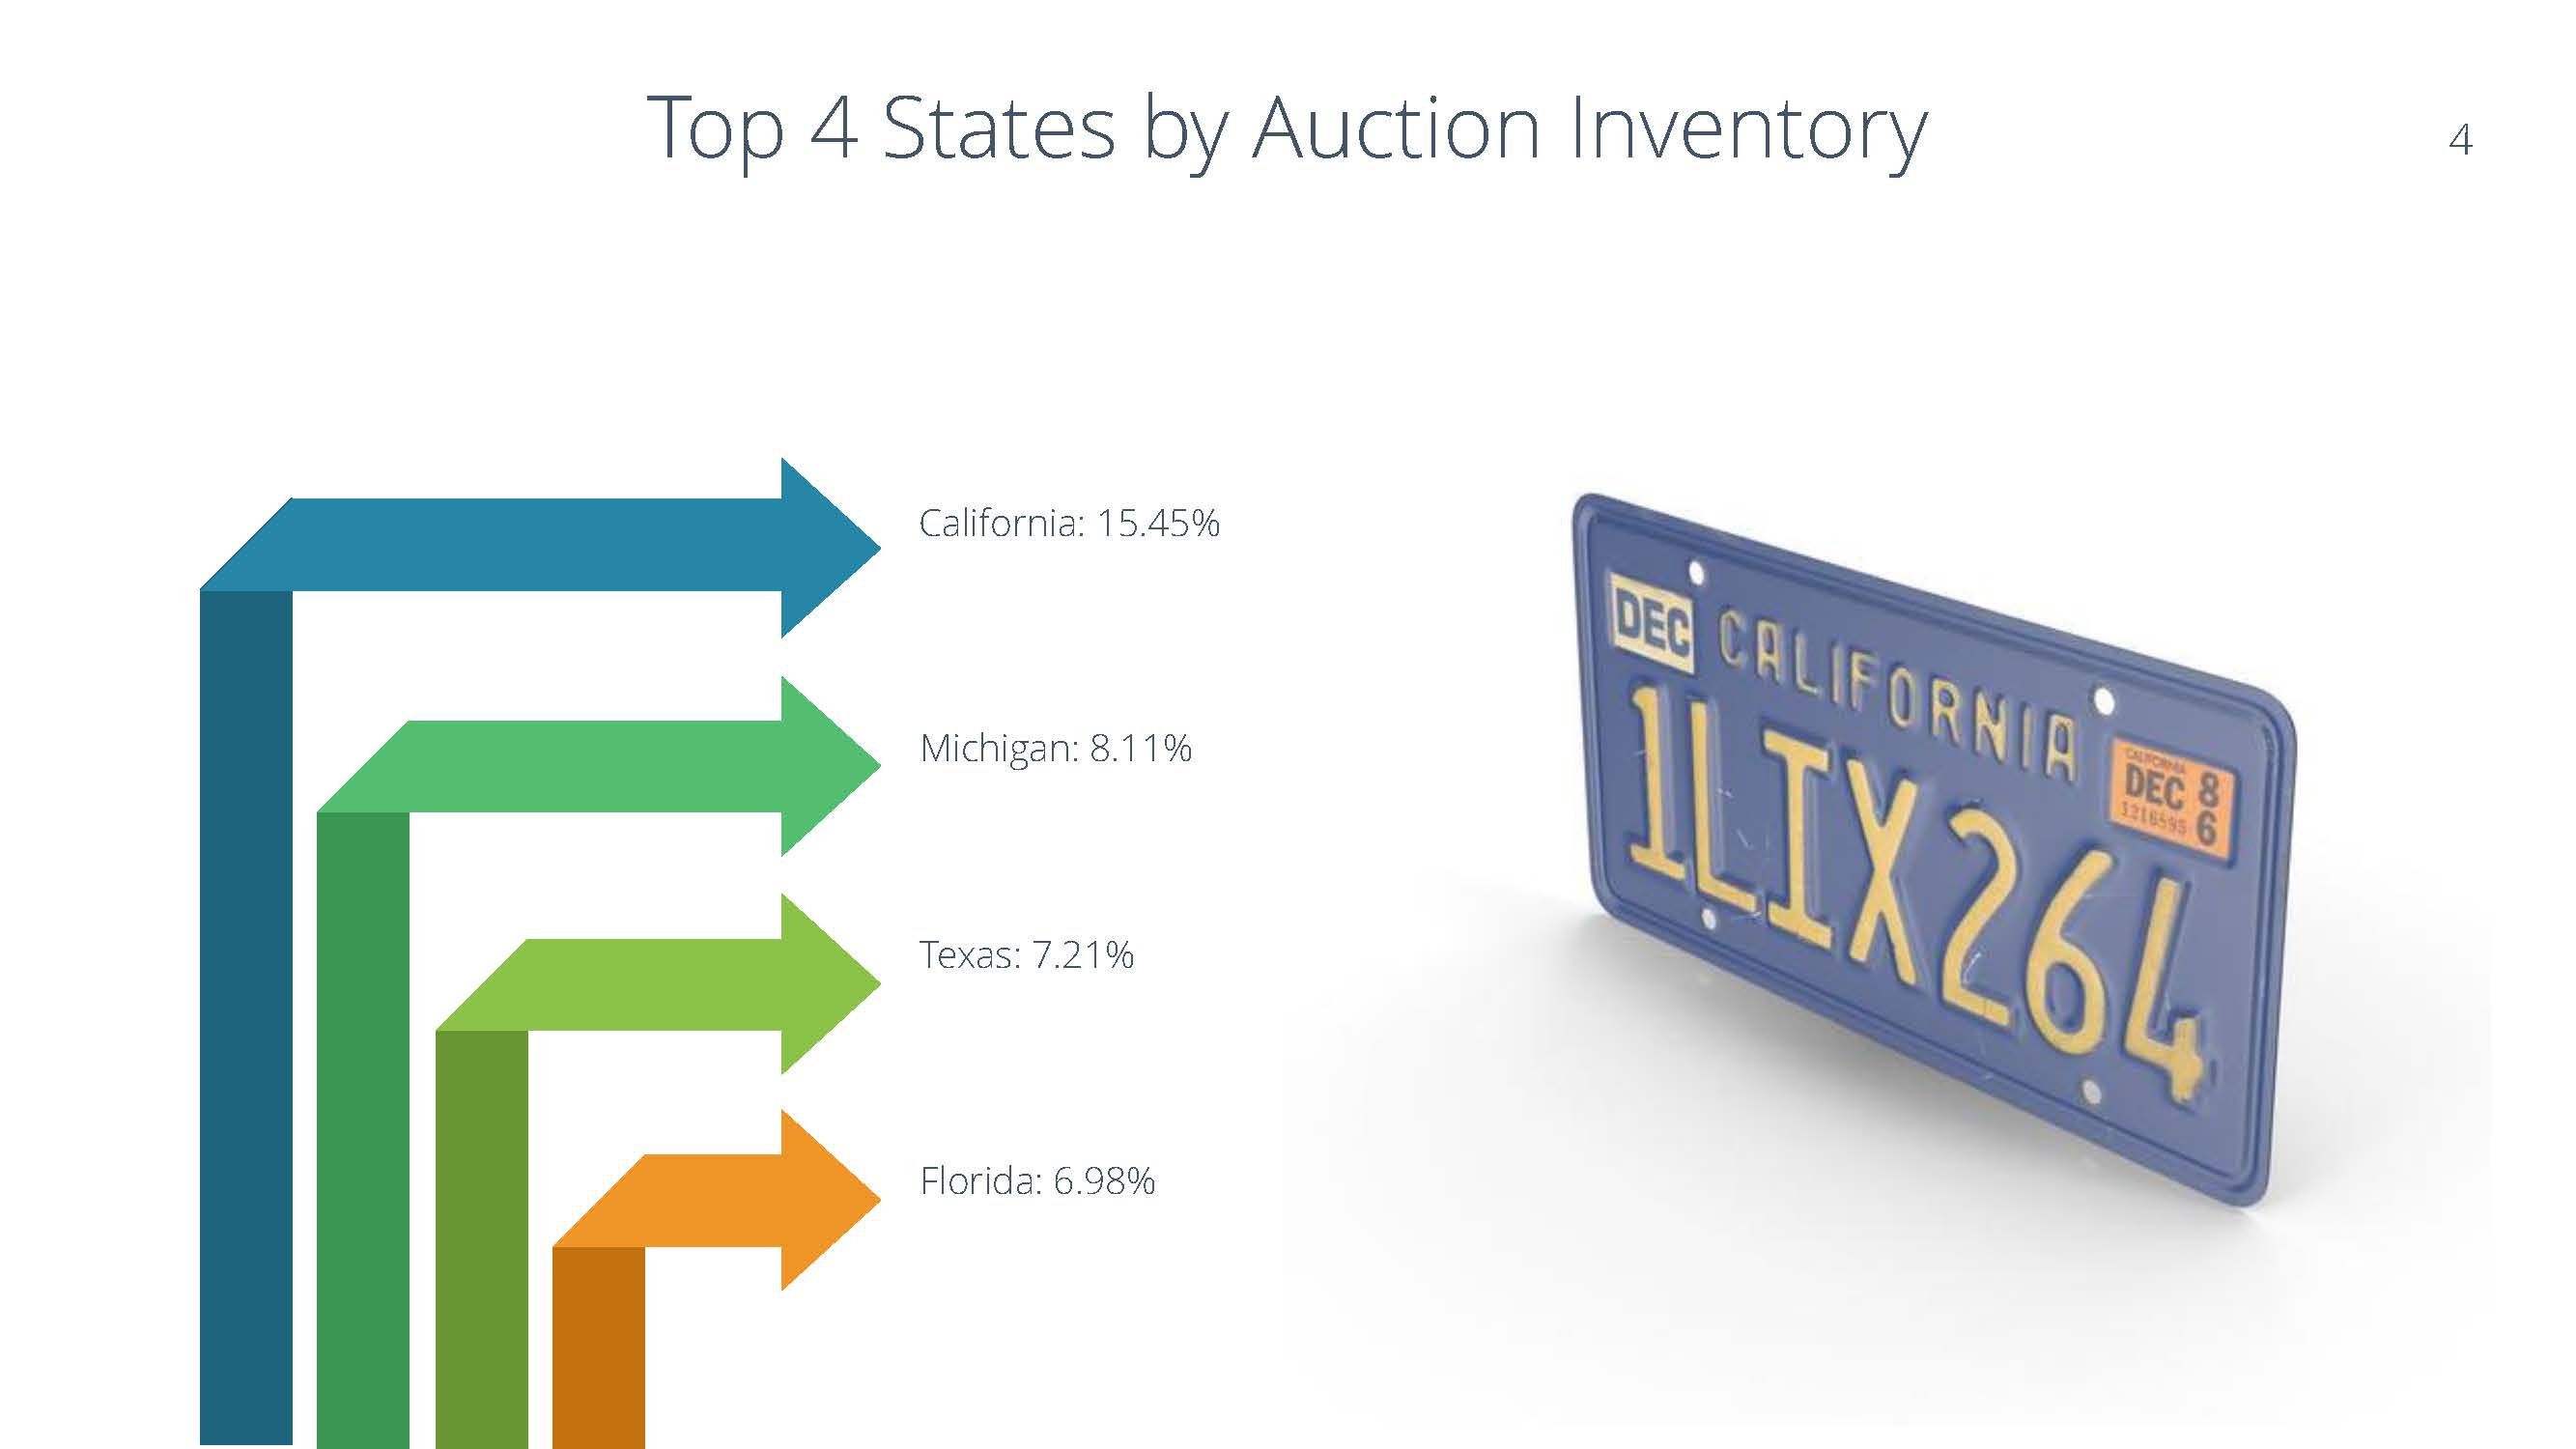
Auction Inventory By State Table:
| State Percentage | ||
| California | CA | 15.45% |
| Michigan | MI | 8.11% |
| Texas | TX | 7.21% |
| Florida | FL | 6.98% |
| New York | NY | 5.57% |
| Ohio | OH | 5.05% |
| Indiana | IN | 4.45% |
| Massachusetts | MA | 4.16% |
| Pennsylvania | PA | 3.50% |
| New Jersey | NJ | 3.49% |
| Arizona | AZ | 3.25% |
| Missouri | MO | 3.23% |
| Virginia | VA | 2.68% |
| Georgia | GA | 2.40% |
| Tennessee | TN | 2.25% |
| North Carolina | NC | 1.97% |
| Alabama | AL | 1.95% |
| Illinois | IL | 1.95% |
| Mississippi | MS | 1.80% |
| Kentucky | KY | 1.38% |
| Washington | WA | 1.38% |
| Utah | UT | 1.37% |
| Iowa | IA | 1.31% |
| Minnesota | MN | 1.10% |
| Oregon | OR | 1.10% |
| Nevada | NV | 1.07% |
| Maryland | MD | 0.74% |
| Wisconsin | WI | 0.66% |
| South Carolina | SC | 0.61% |
| Oklahoma | OK | 0.54% |
| Louisiana | LA | 0.52% |
| Connecticut | CT | 0.48% |
| Colorado | CO | 0.43% |
| Idaho | ID | 0.26% |
| South Dakota | SD | 0.26% |
| Arkansas | AR | 0.24% |
| West Virginia | WV | 0.21% |
| Vermont | VT | 0.11% |
| Rhode Island | RI | 0.11% |
| North Dakota | ND | 0.10% |
| Delaware | DE | 0.10% |
| Kansas | KS | 0.08% |
| New Mexico | NM | 0.08% |
| New Hampshire | NH | 0.08% |
| Nebraska | NE | 0.07% |
| Maine | ME | 0.07% |
| Hawaii | HI | 0.05% |
| Montana | MT | 0.01% |
| Wyoming | WY | 0.00% |
| Alaska | AK | 0.00% |
| District of Columbia | DC | 0.00% |
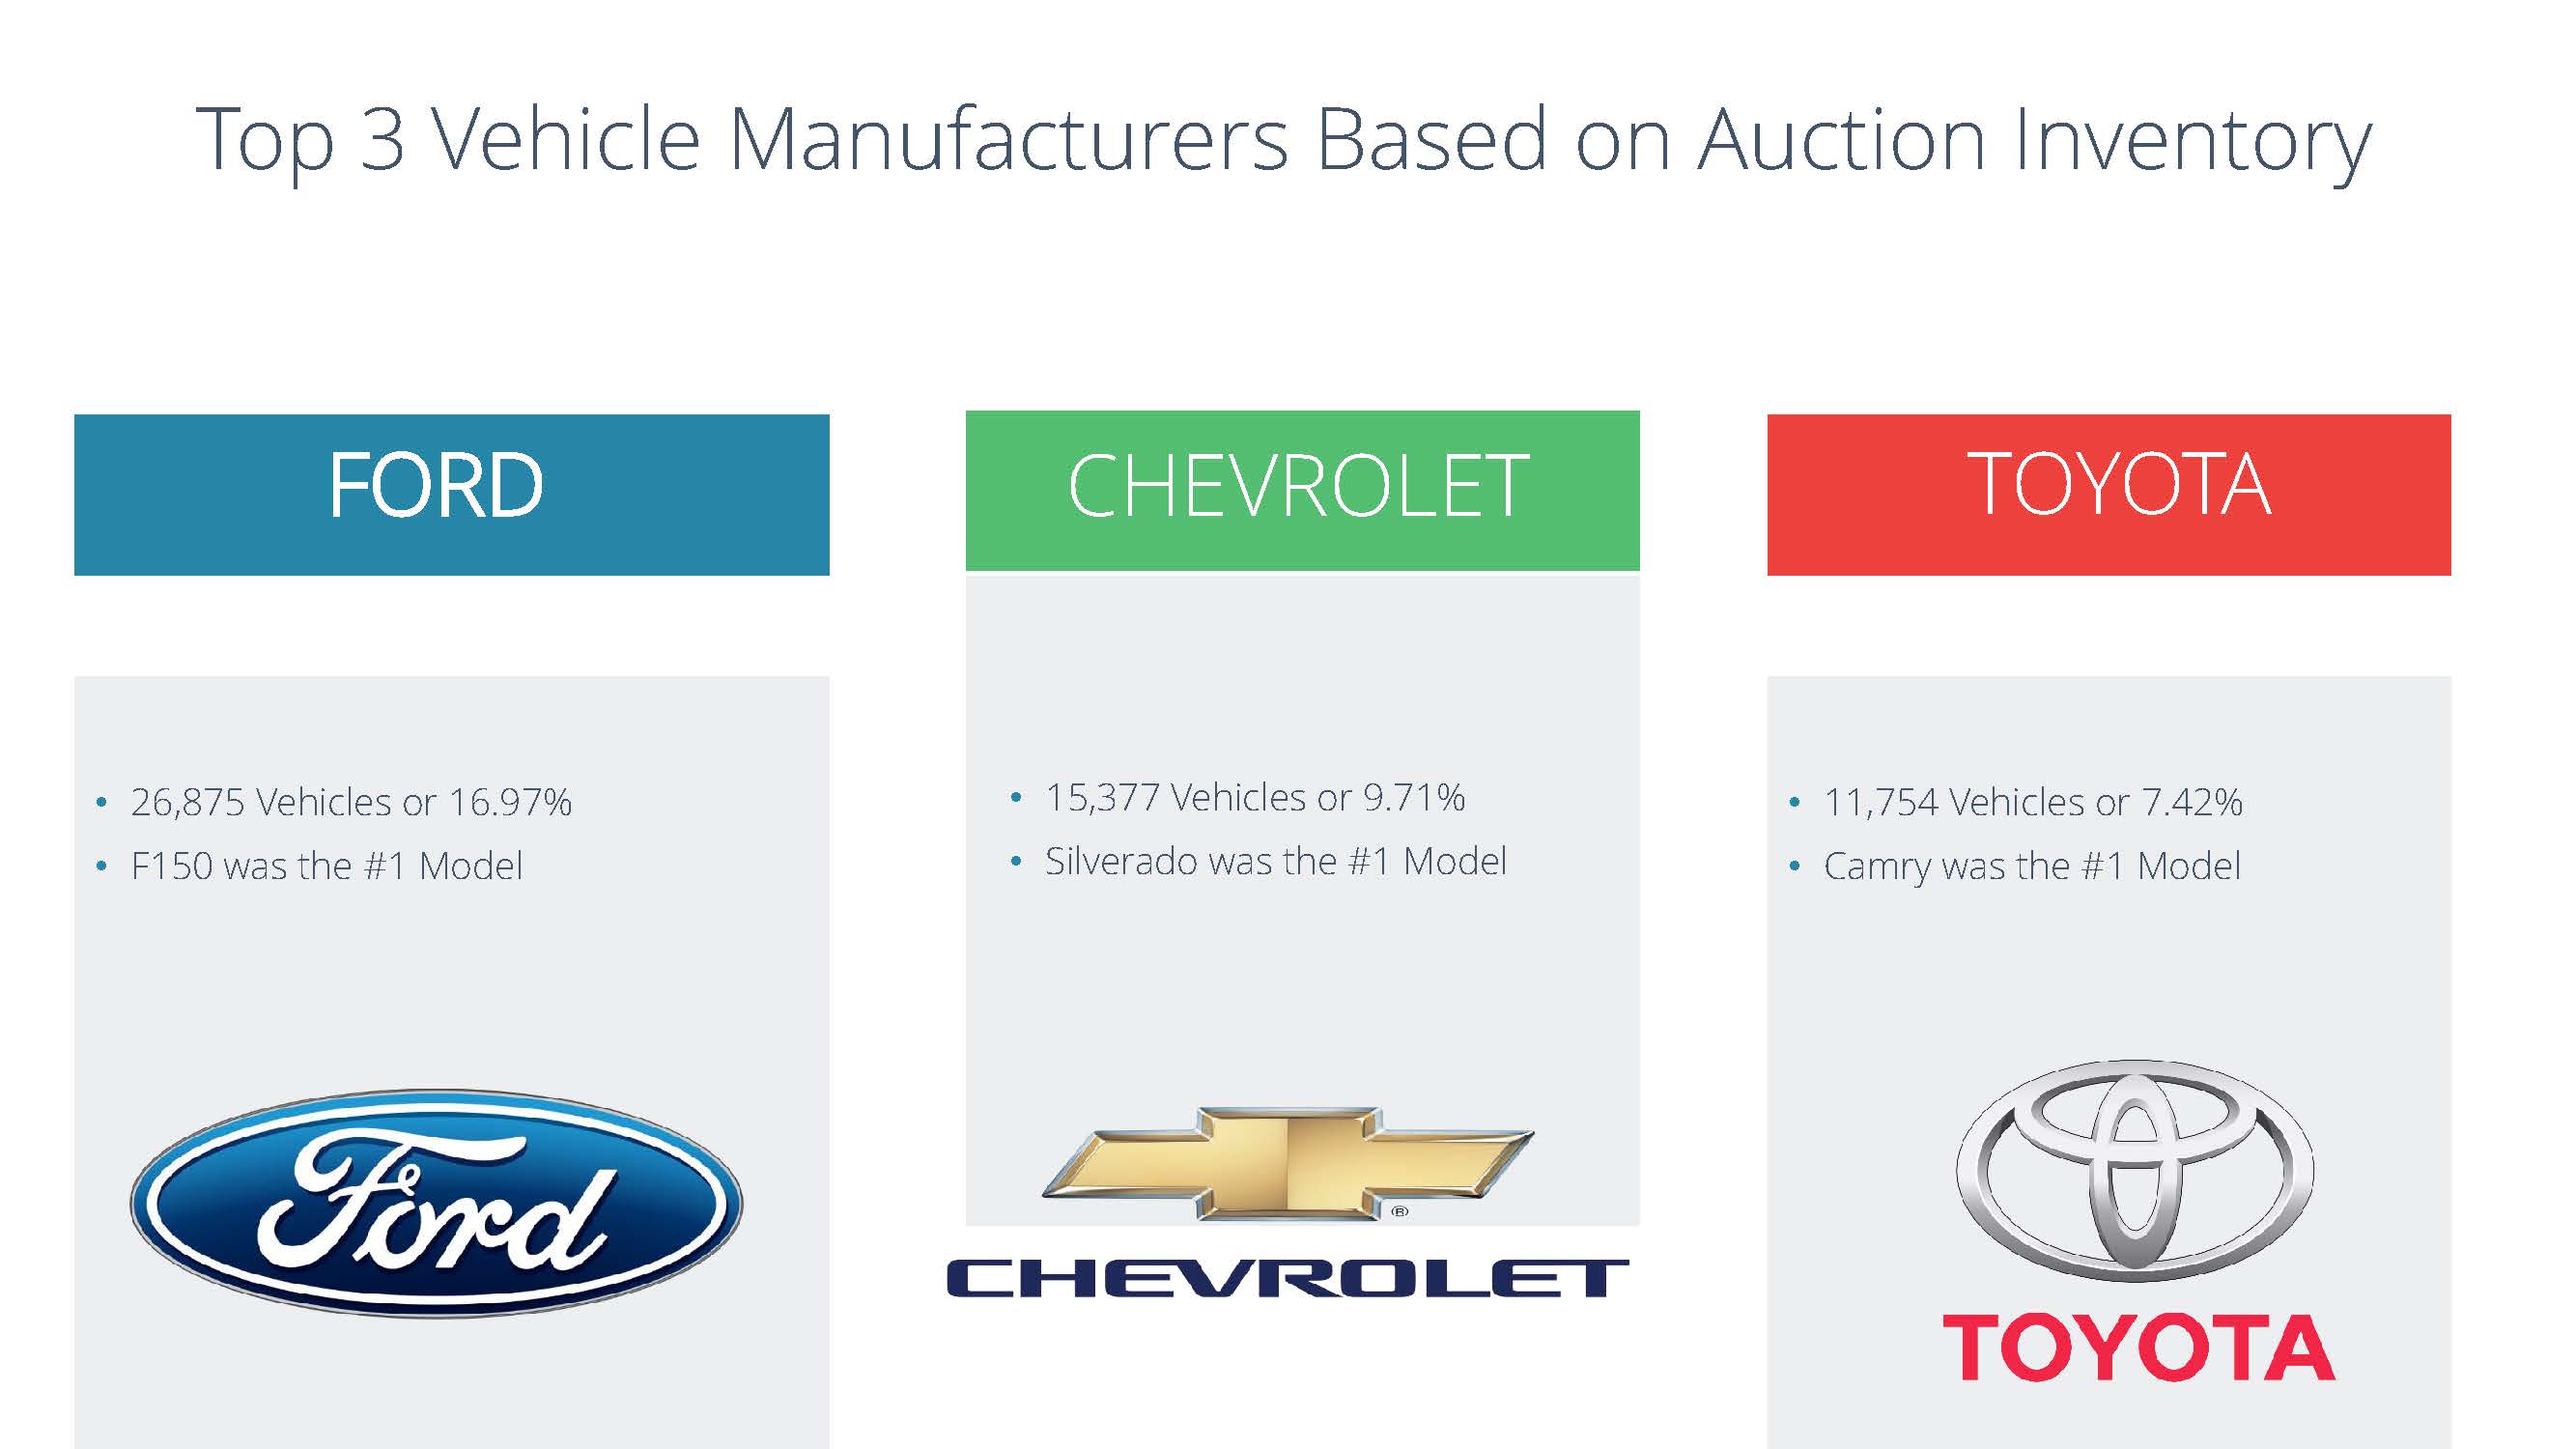
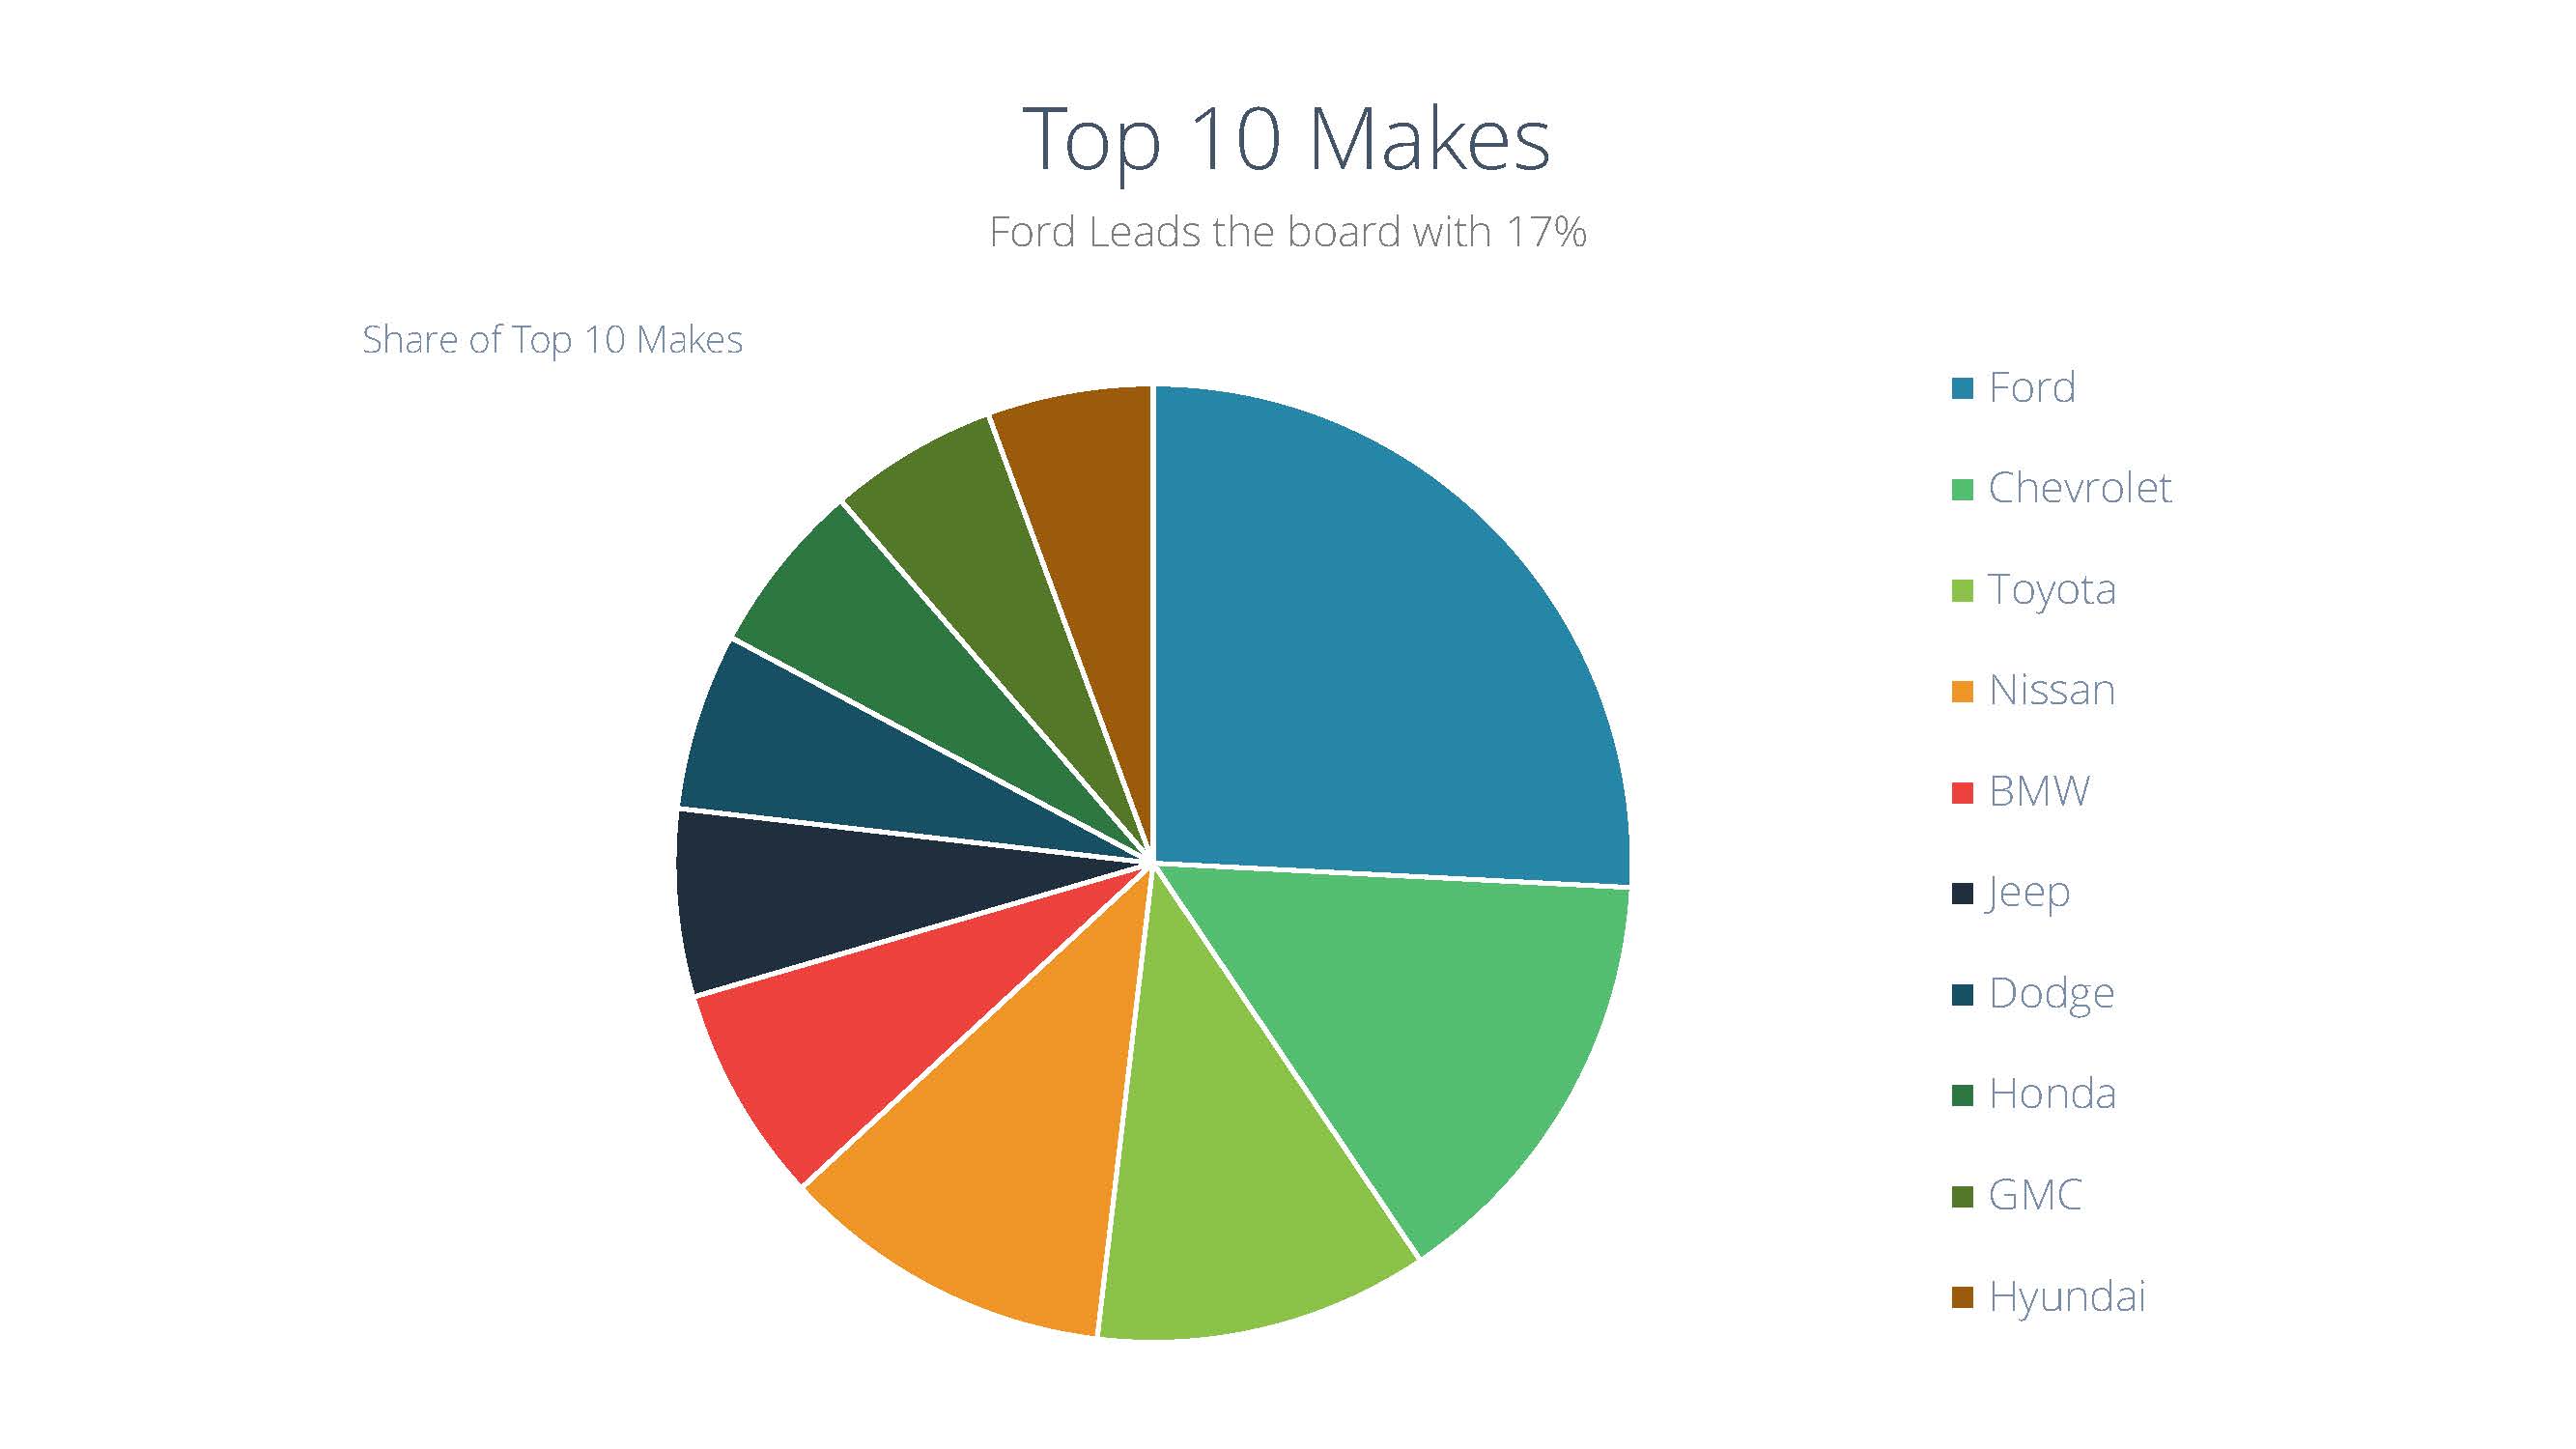
Auction Inventory By Make Table:
| Make | Number of Cars | Percentage |
| Ford | 26,875 | 16.97% |
| Chevrolet | 15,377 | 9.71% |
| Toyota | 11,754 | 7.42% |
| Nissan | 11,729 | 7.41% |
| BMW | 7,663 | 4.84% |
| Jeep | 6,597 | 4.17% |
| Dodge | 6,231 | 3.94% |
| Honda | 6,114 | 3.86% |
| GMC | 5,948 | 3.76% |
| Hyundai | 5,835 | 3.69% |
| Mercedes-Benz | 5,623 | 3.55% |
| Kia | 5,593 | 3.53% |
| Lexus | 4,123 | 2.60% |
| Ram | 3,537 | 2.23% |
| Volkswagen | 3,189 | 2.01% |
| Chrysler | 3,091 | 1.95% |
| Infiniti | 2,678 | 1.69% |
| Mazda | 2,639 | 1.67% |
| Cadillac | 2,465 | 1.56% |
| Audi | 2,139 | 1.35% |
| Subaru | 1,962 | 1.24% |
| Lincoln | 1,764 | 1.11% |
| Land Rover | 1,649 | 1.04% |
| Buick | 1,632 | 1.03% |
| Acura | 1,558 | 0.98% |
| Volvo | 1,534 | 0.97% |
| Porsche | 1,120 | 0.71% |
| Mitsubishi | 894 | 0.56% |
| MINI | 803 | 0.51% |
| Jaguar | 639 | 0.40% |
| Pontiac | 492 | 0.31% |
| Scion | 445 | 0.28% |
| Maserati | 348 | 0.22% |
| Saturn | 320 | 0.20% |
| International | 284 | 0.18% |
| Mercury | 271 | 0.17% |
| Fiat | 266 | 0.17% |
| Harley-Davidson | 260 | 0.16% |
| Hummer | 241 | 0.15% |
| Bentley | 193 | 0.12% |
| Ferrari | 190 | 0.12% |
| Freightliner | 147 | 0.09% |
| Tesla | 146 | 0.09% |
| Suzuki | 136 | 0.09% |
| Isuzu | 107 | 0.07% |
| Lamborghini | 102 | 0.06% |
| Saab | 84 | 0.05% |
| Rolls-Royce | 83 | 0.05% |
| Smart | 71 | 0.04% |
| Alfa Romeo | 66 | 0.04% |
| Keystone | 65 | 0.04% |
| Oldsmobile | 65 | 0.04% |
| Aston Martin | 53 | 0.03% |
| Genesis | 47 | 0.03% |
| Other | 1,179 | |
| 158,416 |
Auction Inventory By Vehicle Type Table:
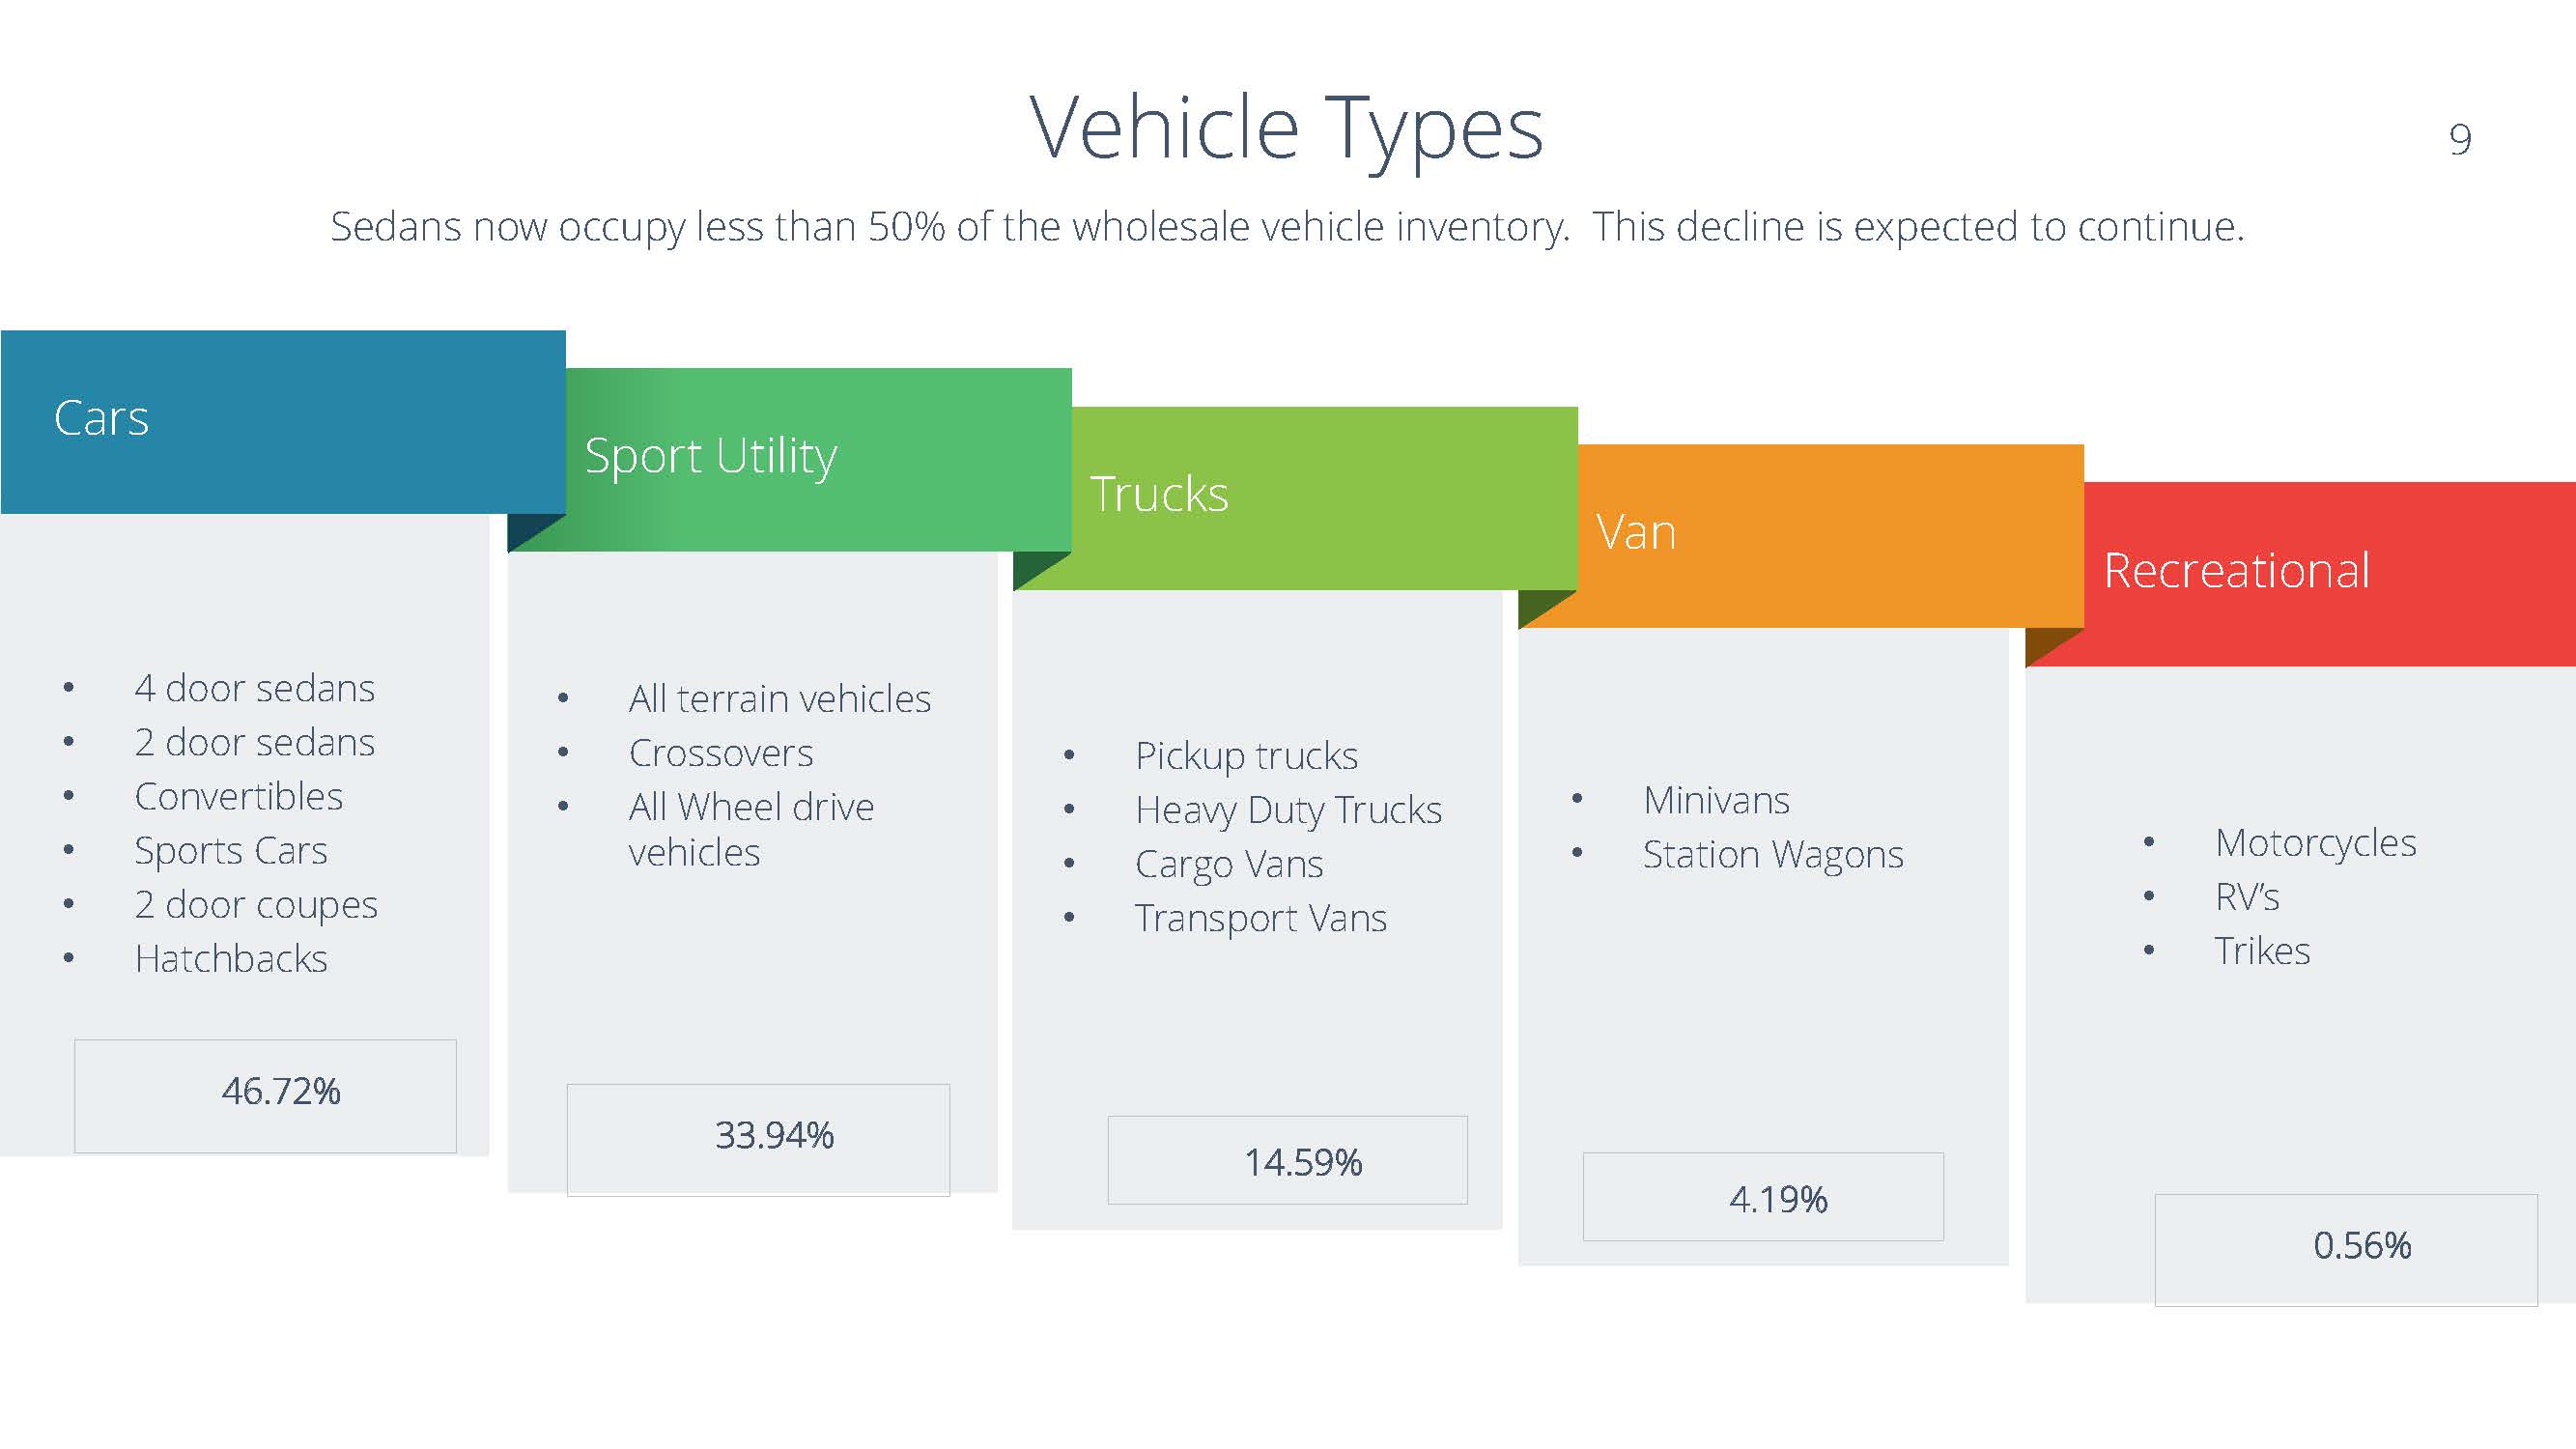
| Car | 73,819 | 46.72% |
| SUV | 53,629 | 33.94% |
| Truck | 23,052 | 14.59% |
| Van | 6,626 | 4.19% |
| Motorcycle | 447 | 0.28% |
| RV | 441 | 0.28% |
| Car | 73,819 | 46.72% |
| Truck/SUV/Van | 83,307 | 52.72% |
| Recreational | 888 | 0.56% |
Auction Inventory By Color Table:
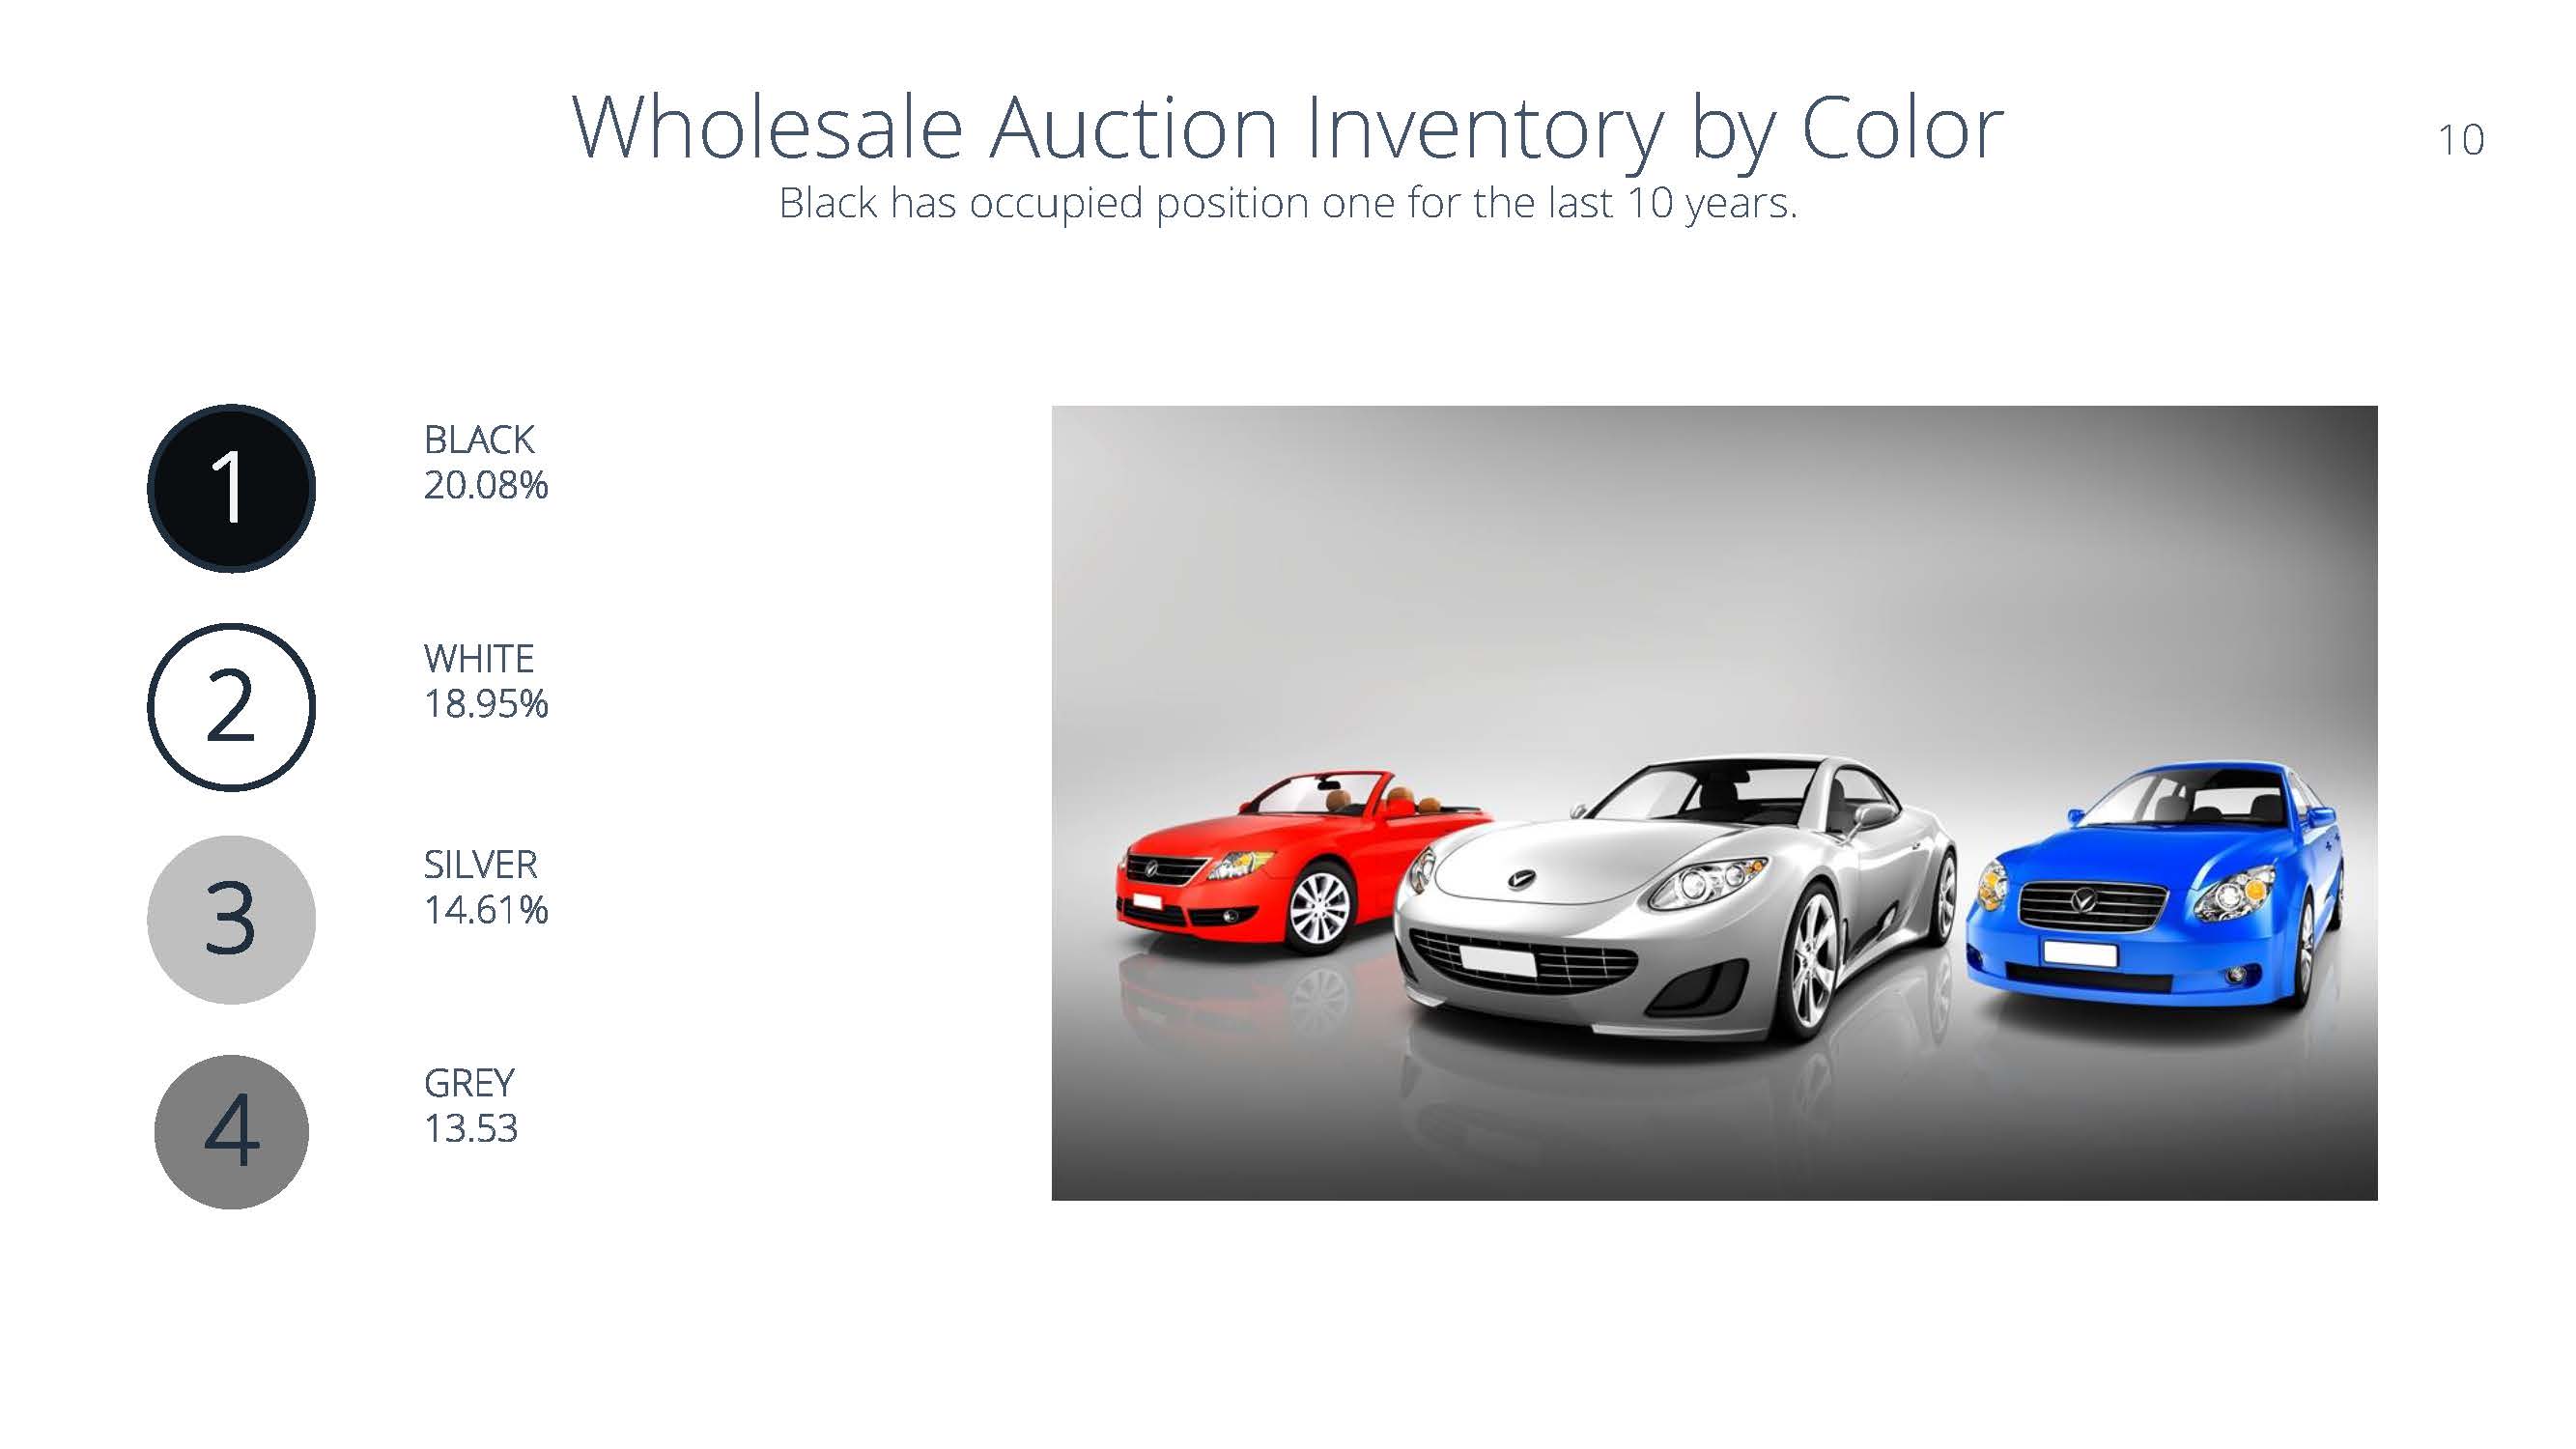
| Black | 20.08% | 11541 |
| White | 18.95% | 10894 |
| Silver | 14.61% | 8396 |
| Gray | 13.53% | 7777 |
| Red | 9.10% | 5232 |
| Blue | 8.34% | 4791 |
| Other | 8.30% | 4772 |
| Brown | 1.54% | 884 |
| Gold | 1.53% | 882 |
| Green | 1.33% | 767 |
| Beige | 1.21% | 693 |
| Purple | 0.67% | 385 |
| Orange | 0.42% | 244 |
| Yellow | 0.38% | 220 |
Auction Inventory By Source Table:
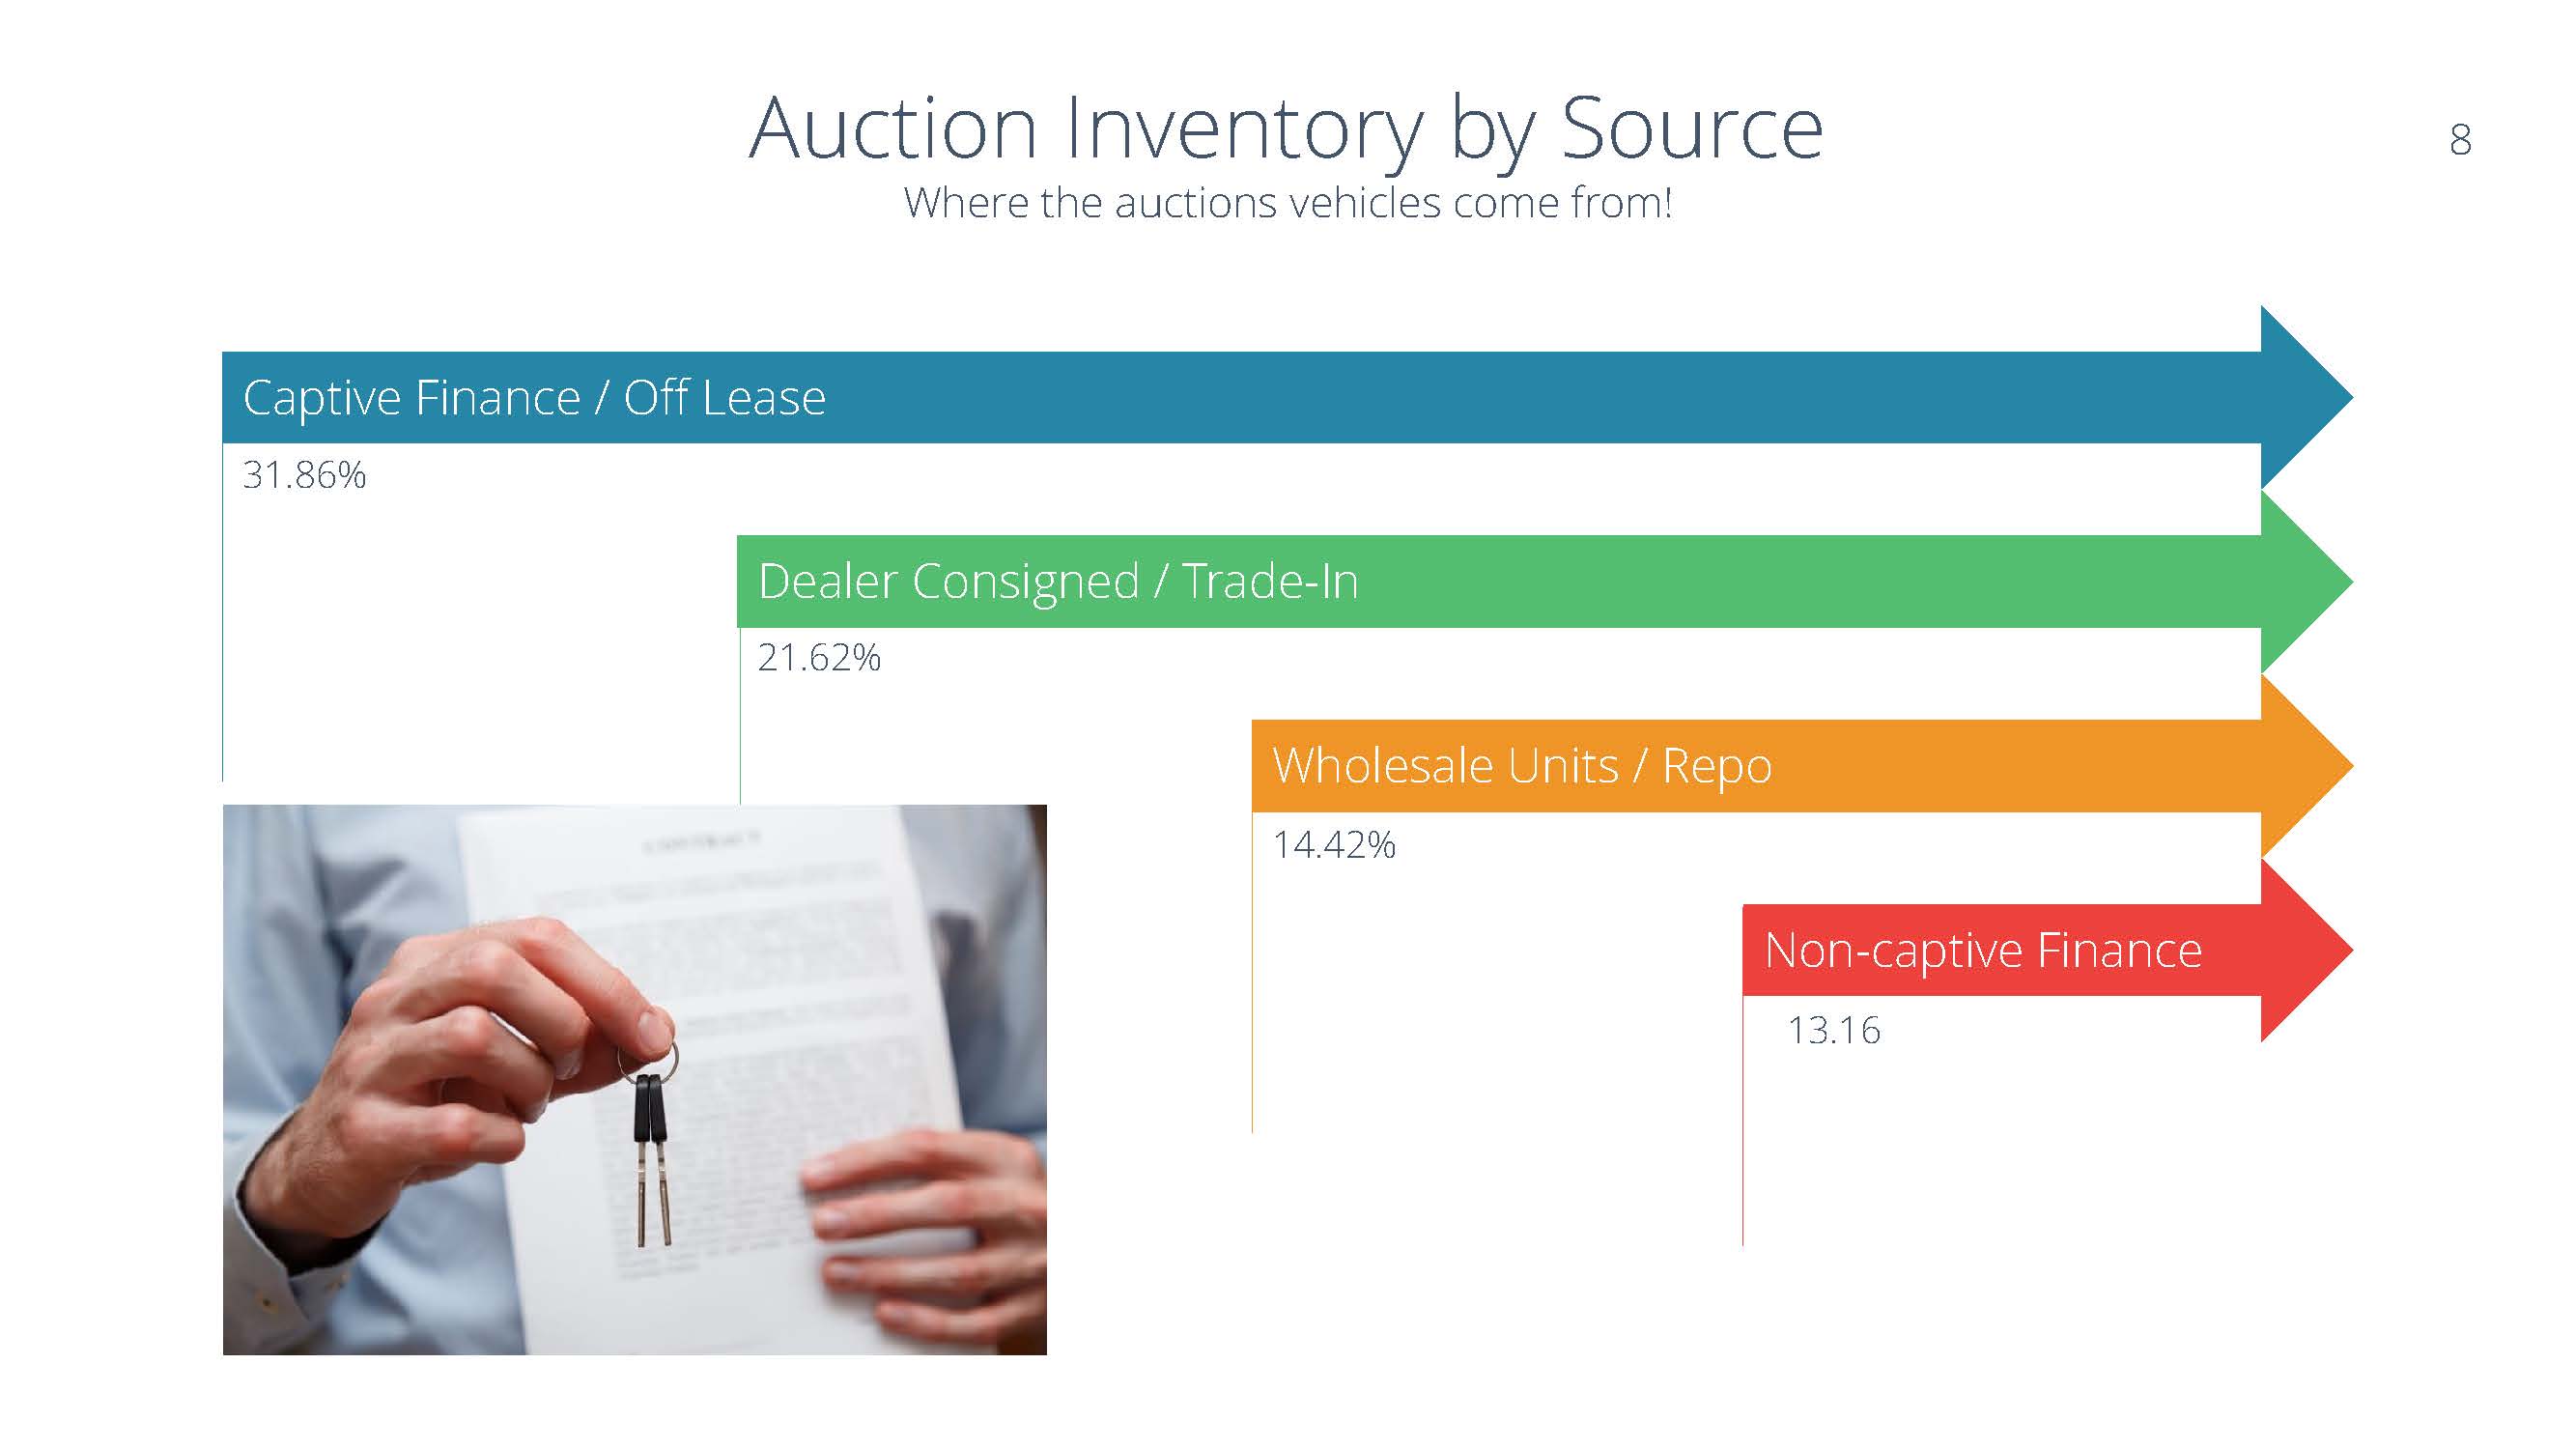
| Captive Finance / Off Lease | 31.86% | 18,312 |
| Dealer Consigned / Trade-In | 21.62% | 12,429 |
| Wholesale Units / Repo | 14.42% | 8,290 |
| Non-captive Finance / Off Lease | 13.16% | 7,566 |
| Fleet / Demo Vehicles | 8.55% | 4,917 |
| Manufacturer / Corporate | 5.30% | 3,045 |
| Retired Rental Cars | 4.84% | 2,780 |
| Other | 0.24% | 139 |
Auction Inventory By Model Year Table:
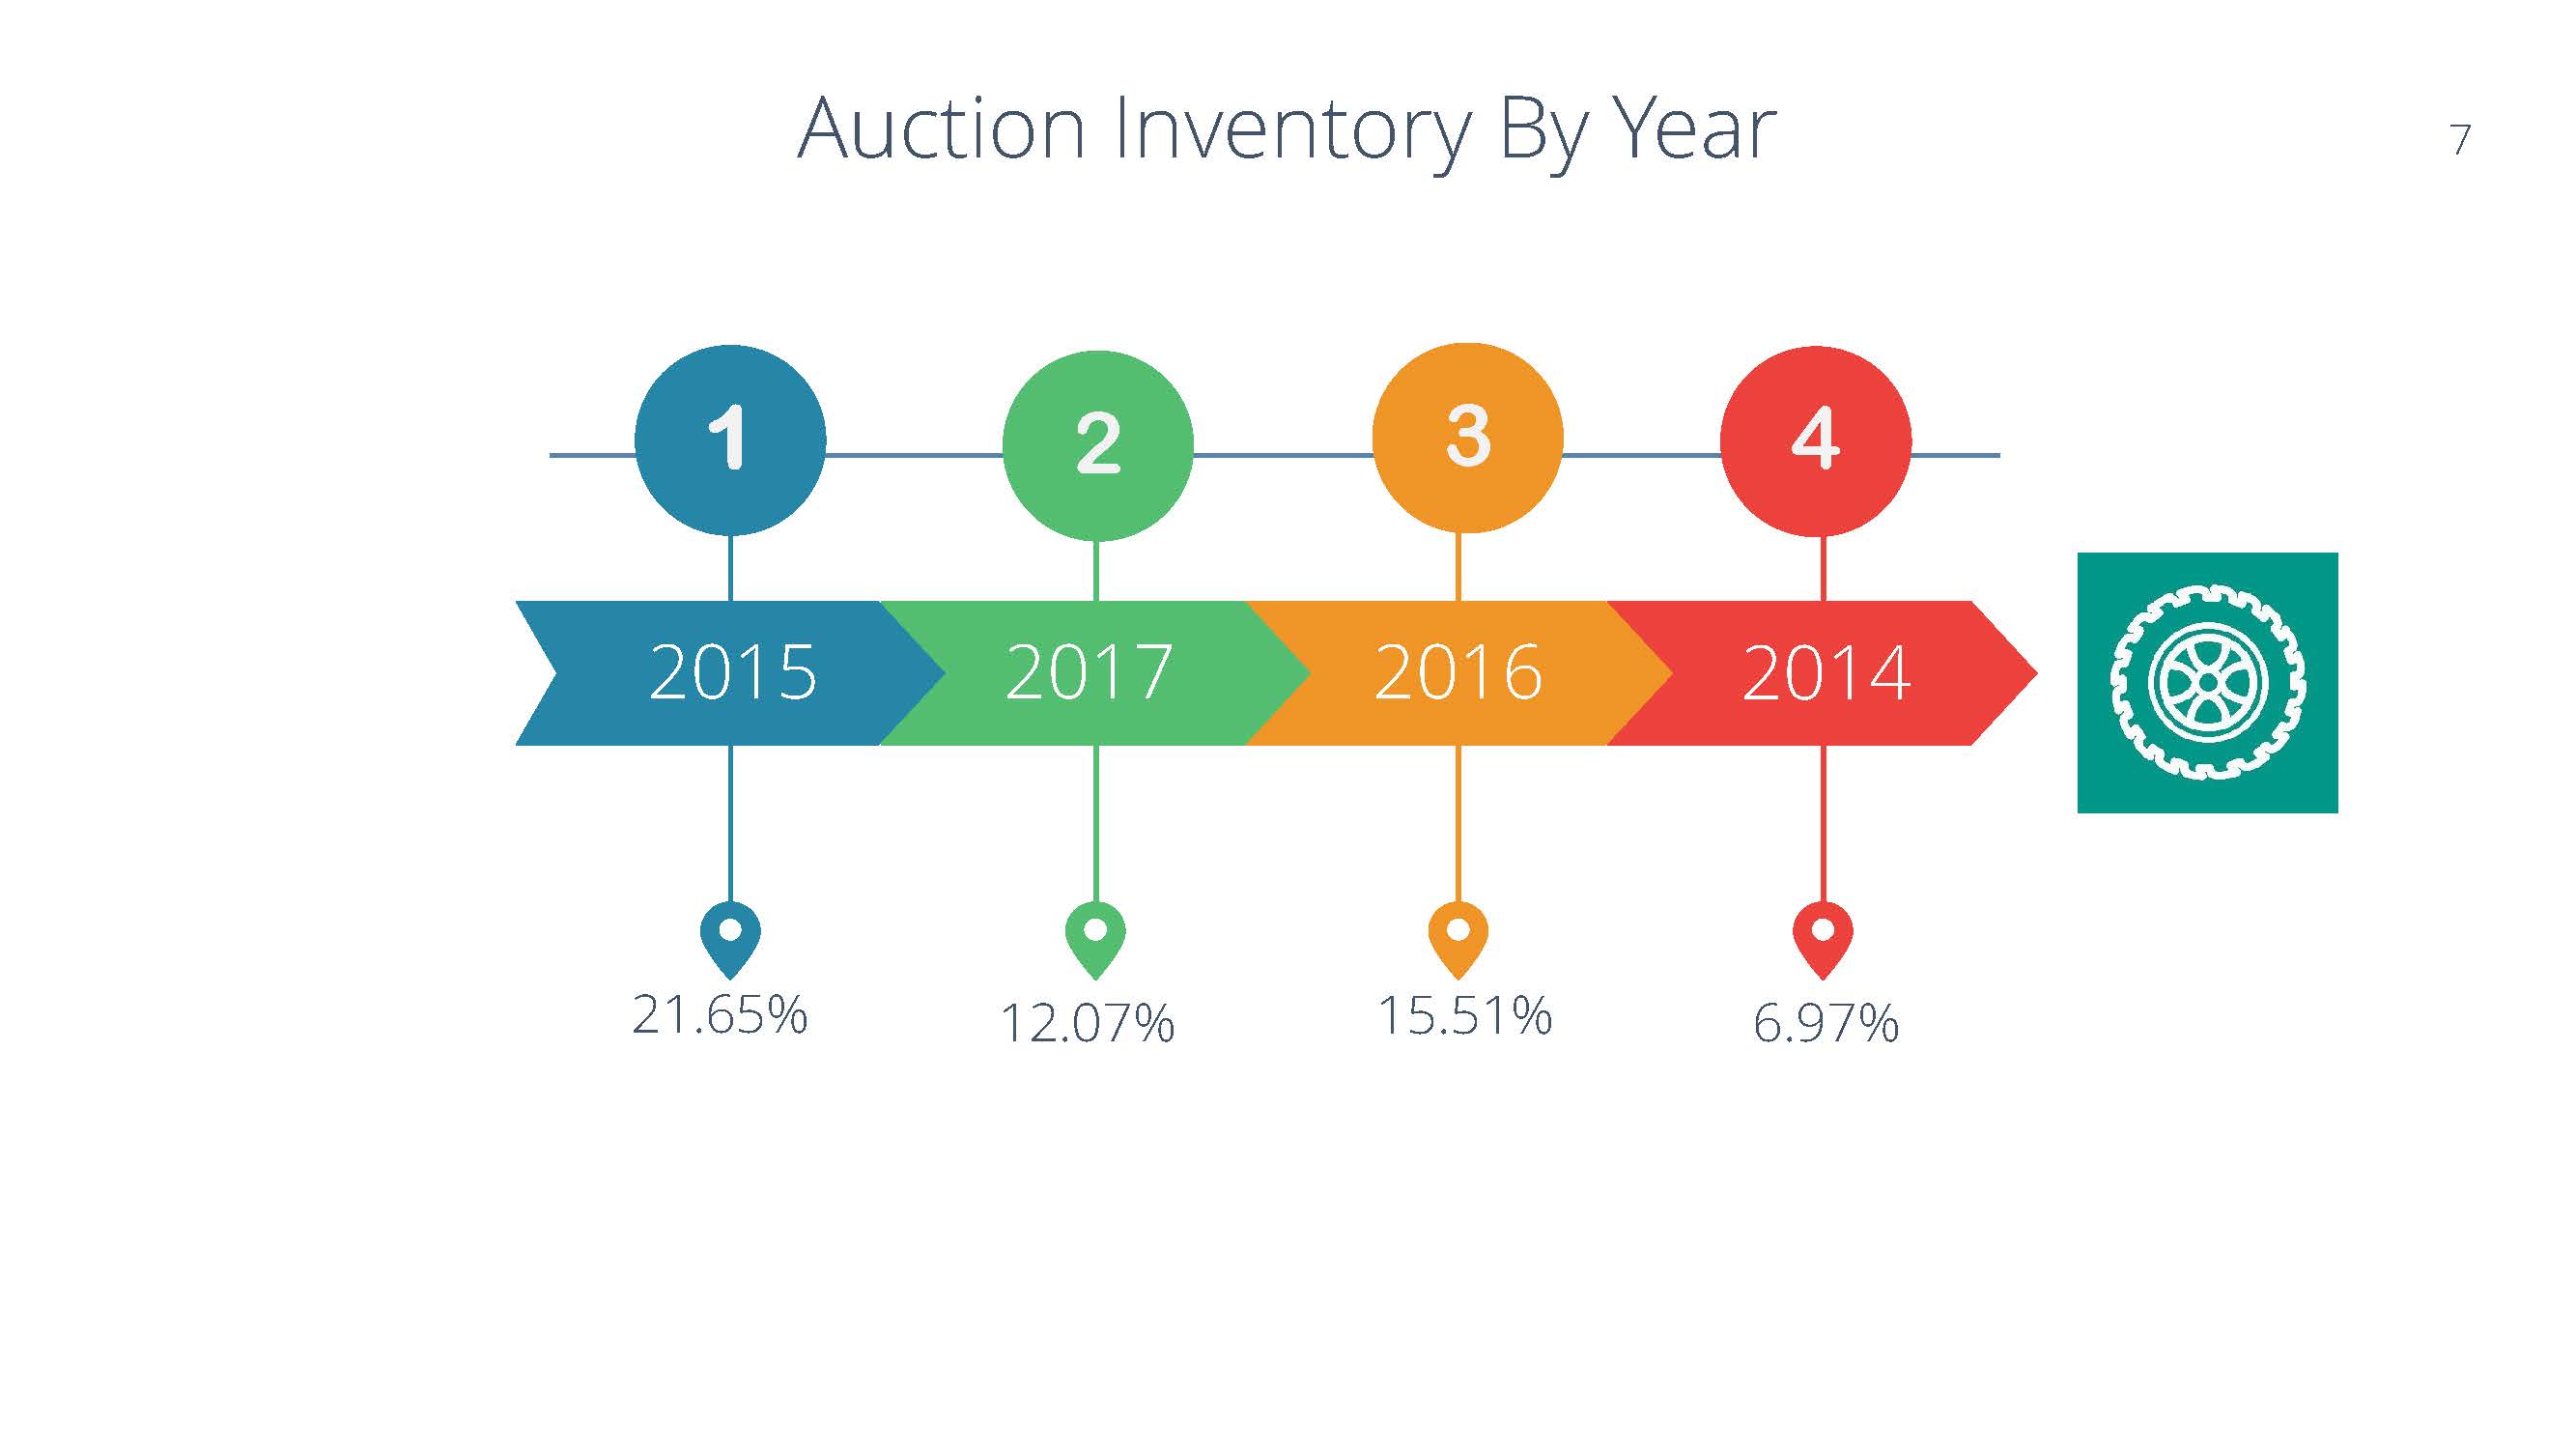
| 2015 Model Year | 34,147 | 21.65% |
| 2017 Model Year | 24,459 | 15.51% |
| 2016 Model Year | 19,034 | 12.07% |
| 2014 Model Year | 10,989 | 6.97% |
| 2018 Model Year | 9,162 | 5.81% |
| 2013 Model Year | 8,038 | 5.10% |
| 2012 Model Year | 7,082 | 4.49% |
| 2011 Model Year | 6,383 | 4.05% |
| 2008 Model Year | 5,920 | 3.75% |
| 2007 Model Year | 5,554 | 3.52% |
| 2010 Model Year | 4,955 | 3.14% |
| 2006 Model Year | 4,401 | 2.79% |
| 2009 Model Year | 3,975 | 2.52% |
| 2005 Model Year | 3,585 | 2.27% |
| 2004 Model Year | 2,744 | 1.74% |
| 2003 Model Year | 2,040 | 1.29% |
| 2002 Model Year | 1,503 | 0.95% |
| 2001 Model Year | 1,033 | 0.66% |
| 2000 Model Year | 799 | 0.51% |
| 1999 Model Year | 564 | 0.36% |
| 1998 Model Year | 345 | 0.22% |
| 1997 Model Year | 235 | 0.15% |
| 1996 Model Year | 175 | 0.11% |
| 1995 Model Year | 153 | 0.10% |
| 1994 Model Year | 131 | 0.08% |
| 1991 Model Year | 78 | 0.05% |
| 1993 Model Year | 77 | 0.05% |
| 1992 Model Year | 57 | 0.04% |
| 1990 Model Year | 50 | 0.03% |
| 2019 Model Year | 28 | 0.02% |
Interesting Car Auction Statistics
| Other Statsistics | |||
| All Vehicles | 158,416 | ||
| Under $20,000 | 101,388 | 64.00% | |
| Manual Transmission | 4,698 | 2.97% | |
| Diesel Powered | 5,109 | 3.23% | |
| Electric Vehicle | 408 | 0.26% | |
| With Cloth Seats | 66,678 | 42.09% | |

