2019 Vehicle Sales by Segment (PDF)
This US Car market report provides information about passenger cars, including economy and family, sports and luxury vehicles as well as minivans and Sport Utility Vehicles. It excludes motorcycles, buses, trucks and large vans.
The market segmentation is based on several factors, including physical properties (mass, volume, footprint = (front track width + rear track width)/2 x wheelbase, etc.) and consumer base (pricing, status, etc.).
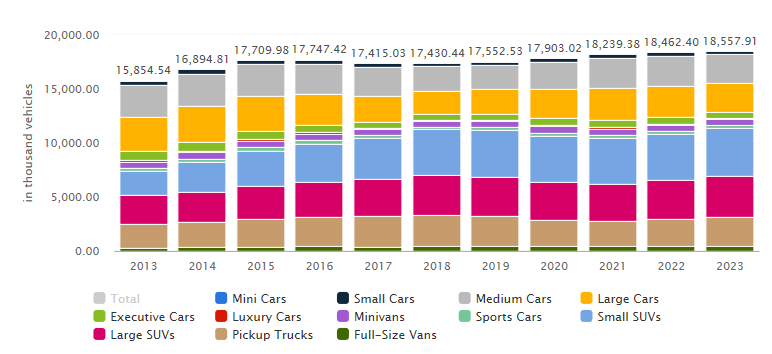
- 2019 Vehicle Sales by segment is up 0.7% from 2018 to $17,552 Trillion
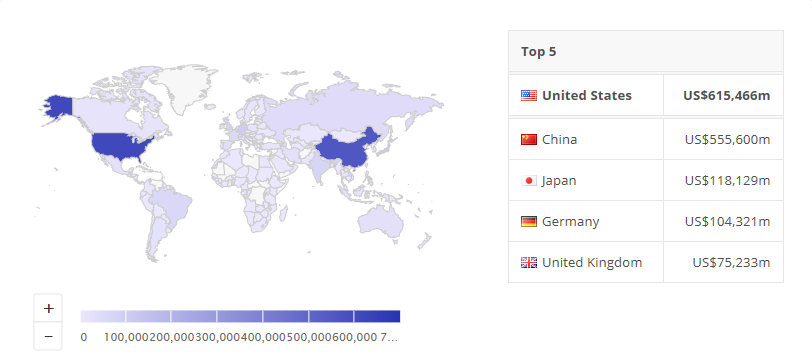
- 2019 Vehicle Revenue by Segment is up 0.9% from 2018 to $615 Billion
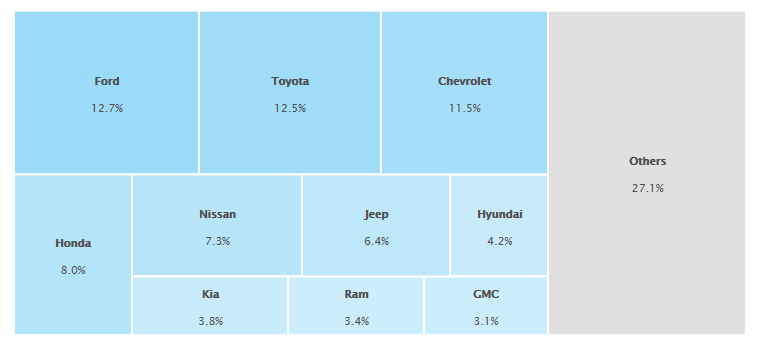
- Ford leads the US in sales market share with 12.7% followed by Toyota with 12.5%
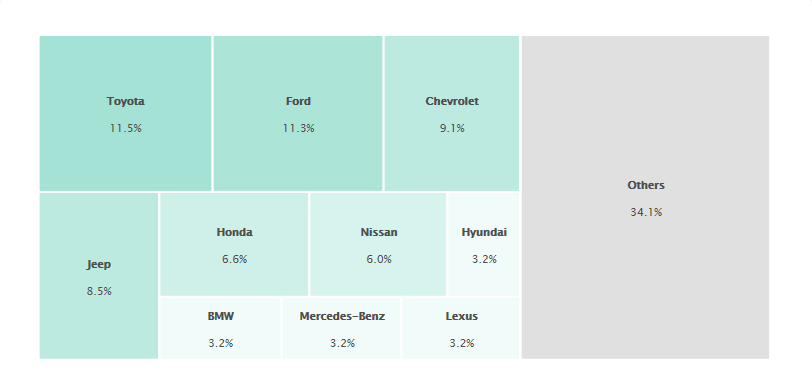
- Toyota leads the US in revenue market share with 11.5% followed by Ford with 11.3%
- The US is the worlds leader in Auto sales revenue with $615 Billion, followed by China with $555 Billion
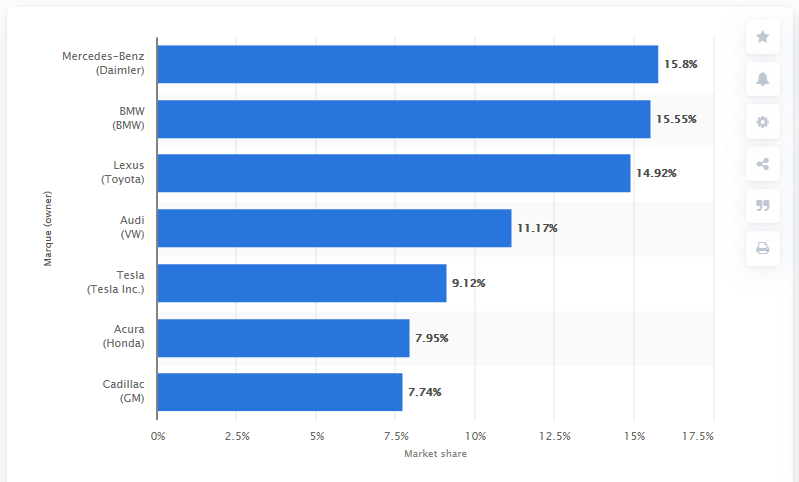
- Among Luxury brands, Mercedes leads with 15.8% market share
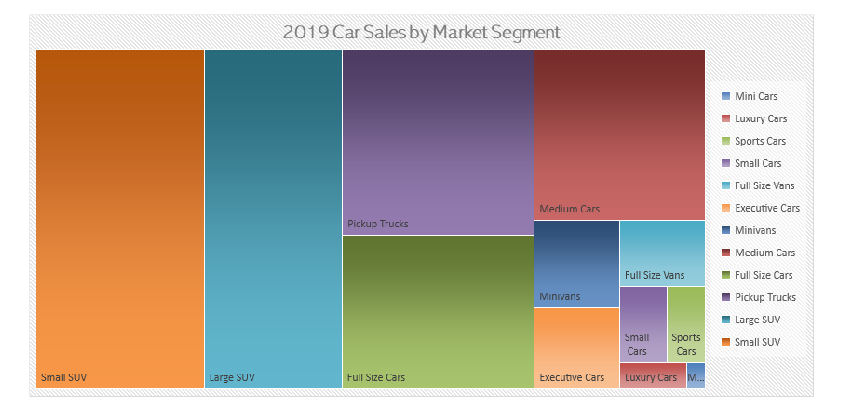
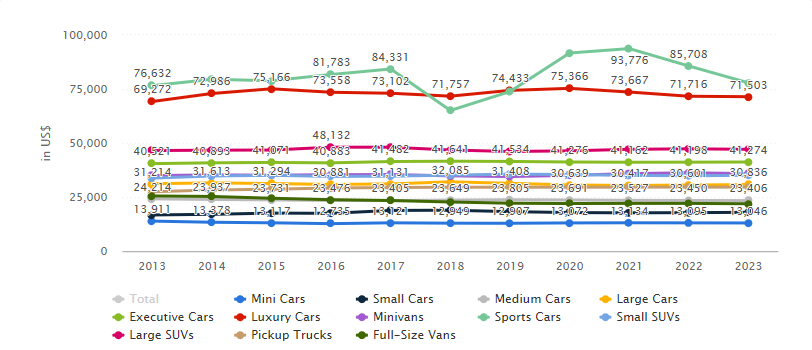
| Segment | Sales (Trillion USD) | Share |
| Mini Cars | $ 36.88 | 0.21% |
| Luxury Cars | $ 134.74 | 0.77% |
| Sports Cars | $ 226.09 | 1.29% |
| Small Cars | $ 277.26 | 1.58% |
| Full Size Vans | $ 432.63 | 2.46% |
| Executive Cars | $ 534.71 | 3.05% |
| Minivans | $ 577.45 | 3.29% |
| Medium Cars | $ 2,260.62 | 12.88% |
| Full Size Cars | $ 2,276.08 | 12.97% |
| Pickup Trucks | $ 2,765.96 | 15.76% |
| Large SUV | $ 3,619.34 | 20.62% |
| Small SUV | $ 4,410.77 | 25.13% |
| $ 17,552.53 | 100.00% |
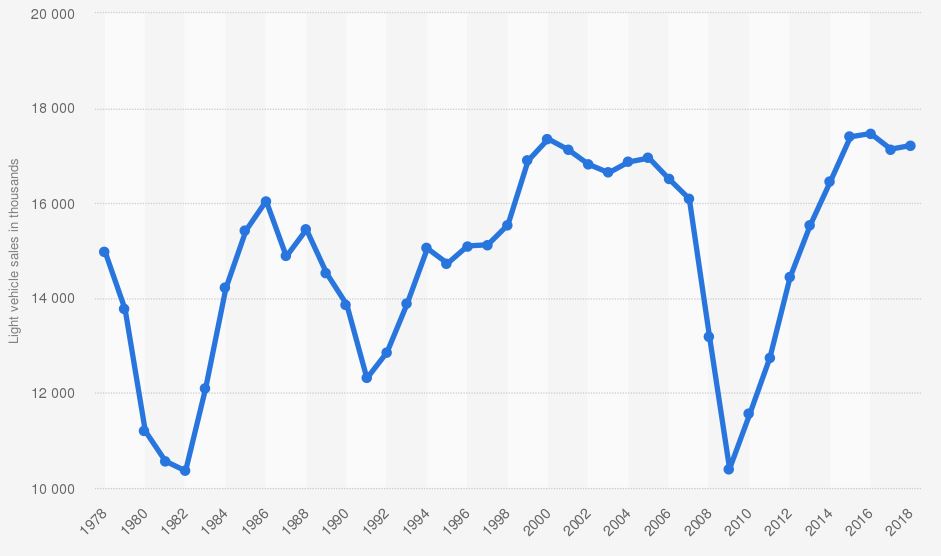
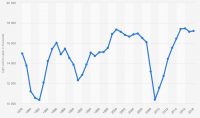
Vehicle sales in the United States 1978-2019
| Table containing the total number of Cars, Light Trucks and SUVs sold in United States from 1978 to 2019 | ||
| Year | Units Sold | Year / Year |
| 1978 | 14,981 Million | |
| 1979 | 13,758 Million | -8.16% |
| 1980 | 11,198 Million | -18.61% |
| 1981 | 10,564 Million | -5.66% |
| 1982 | 10,357 Million | -1.95% |
| 1983 | 12,107 Million | 16.89% |
| 1984 | 14,205 Million | 17.33% |
| 1985 | 15,425 Million | 8.59% |
| 1986 | 16,044 Million | 4.01% |
| 1987 | 14,875 Million | -7.29% |
| 1988 | 15,443 Million | 3.82% |
| 1989 | 14,521 Million | -5.97% |
| 1990 | 13,860 Million | -4.55% |
| 1991 | 12,309 Million | -11.19% |
| 1992 | 12,857 Million | 4.45% |
| 1993 | 13,883 Million | 7.98% |
| 1994 | 15,045 Million | 8.37% |
| 1995 | 14,728 Million | -2.10% |
| 1996 | 15,097 Million | 2.50% |
| 1997 | 15,122 Million | 0.16% |
| 1998 | 15,543 Million | 2.78% |
| 1999 | 16,894 Million | 8.69% |
| 2000 | 17,350 Million | 2.70% |
| 2001 | 17,122 Million | -1.31% |
| 2002 | 16,816 Million | -1.79% |
| 2003 | 16,639 Million | -1.05% |
| 2004 | 16,867 Million | 1.37% |
| 2005 | 16,948 Million | 0.48% |
| 2006 | 16,504 Million | -2.62% |
| 2007 | 16,089 Million | -2.52% |
| 2008 | 13,195 Million | -17.99% |
| 2009 | 10,402 Million | -21.16% |
| 2010 | 11,555 Million | 11.08% |
| 2011 | 12,742 Million | 10.27% |
| 2012 | 14,433 Million | 13.27% |
| 2013 | 15,530 Million | 7.60% |
| 2014 | 16,452 Million | 5.94% |
| 2015 | 17,396 Million | 5.74% |
| 2016 | 17,465 Million | 0.39% |
| 2017 | 17,136 Million | -1.88% |
| 2018 | 17,214 Million | 0.45% |
| 2019 | 17,552 Million | 1.97% |

