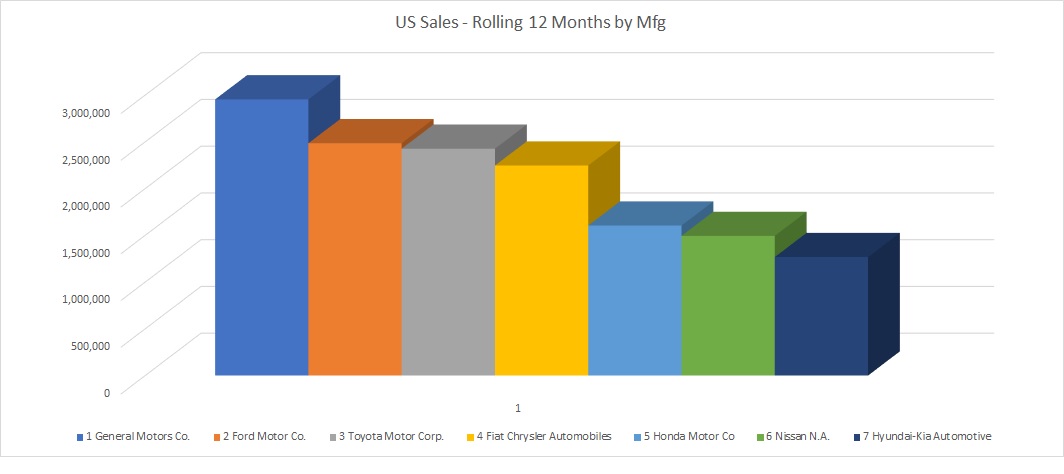
US Vehicle Sales – Year over Year by Manufacturer
US Vehicle Sales – Year over Year by Manufacturer 2017 vs 2018 Totals
Below is a list of the number of vehicles sold in the United States ranked by manufacturer.
The list also shows the difference between the number of cars sold in 2018 versus 2017.
- Top Car Maker by Volume: General Motors (2.9 Million Units)
- Biggest Winner: Tesla (+280% year over year)
- Biggest Loser: Nissan (-6.2% year over year)
| Rank | Manufacturer | Units Sold in 2018 | Units Sold in 2017 | Units Change | Percentage Change |
| 1 | General Motors Co. | 2,954,037 | 3,002,241 | -48,204 | -1.60% |
| 2 | Ford Motor Co. | 2,485,222 | 2,575,200 | -89,978 | -3.50% |
| 3 | Toyota Motor Corp. | 2,426,672 | 2,434,517 | -7,845 | -0.30% |
| 4 | Fiat Chrysler Automobiles | 2,246,467 | 2,073,075 | 173,392 | 8.40% |
| 5 | Honda Motor Co | 1,604,828 | 1,641,429 | -36,601 | -2.20% |
| 6 | Nissan N.A. | 1,493,877 | 1,593,464 | -99,587 | -6.20% |
| 7 | Hyundai-Kia Automotive | 1,267,618 | 1,275,223 | -7,605 | -0.60% |
| 8 | Subaru (Fuji Heavy Ind.) | 680,135 | 647,956 | 32,179 | 5.00% |
| 9 | Volkswagen Group | 637,689 | 625,107 | 12,582 | 2.00% |
| 10 | BMW Group | 355,778 | 353,819 | 1,959 | 0.60% |
| 11 | Daimler AG | 355,413 | 375,311 | -19,898 | -5.30% |
| 12 | Mazda Motor Corp. | 300,325 | 289,470 | 10,855 | 3.70% |
| 13 | Tesla Motors Inc | 182,400 | 48,000 | 134,400 | 280.00% |
| 14 | Jaguar Land Rover N.A. | 122,626 | 114,333 | 8,293 | 7.30% |
| 15 | Mitsubishi Motors Corp. | 118,074 | 103,686 | 14,388 | 13.90% |
| 16 | Volvo Cars N.A. | 98,263 | 81,504 | 16,759 | 20.60% |
| 17 | Ferrari North America Inc | 2,336 | 2,312 | 24 | 1.00% |
| 18 | McLaren Automotive | 1,569 | 1,112 | 457 | 41.10% |
| 19 | Aston Martin | 984 | 1,000 | -16 | -1.60% |
| 20 | Lotus Cars | 168 | 156 | 12 | 7.70% |
| Total US Sales | 17,334,481 | 17,238,915 | 95,566 | 0.60% |


