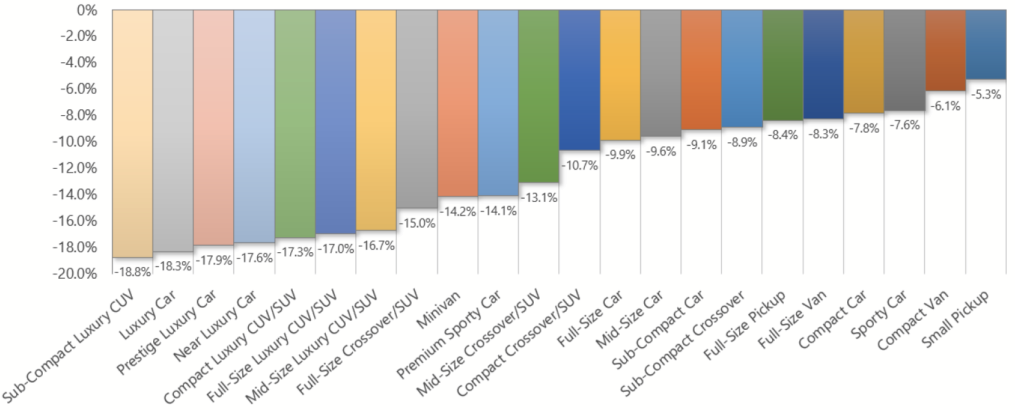
Year to Year Depreciation by Segment – Winners and Losers
Analysis of Vehicle Depreciation from Oct 1, 2017 to Oct 1, 2018
- Small Pickups showing the strongest retention at -5.3%
- Sub-Compact Luxury CUVs showing the greatest depreciation at -18.8%.

| Type | Segment | Depreciation |
| SUV | Sub Compact Luxury CUV | -18.8% |
| Car | Luxury Car | -18.3% |
| Car | Prestige Luxury Car | -17.9% |
| Car | Near Luxury Car | -17.6% |
| SUV | Compact Luxury CUV / SUV | -17.3% |
| SUV | Full Size Luxury CUV / SUV | -17.0% |
| SUV | Mid-Size Luxury CUV/SUV | -16.7% |
| SUV | Full Size Crossover / SUV | -15.0% |
| Van | Minivan | -14.2% |
| Car | Premium Sporty Car | -14.1% |
| SUV | Mid-Size Crossover / SUV | -13.1% |
| SUV | Compact Crossover / SUV | -10.7% |
| Car | Full-Size Car | -9.9% |
| Car | Mid-Size Car | -9.6% |
| Car | Sub-Compact Car | -9.1% |
| Crossover | Sub-Compact Crossover | -8.9% |
| Pickup | Full-Size Pickup | -8.4% |
| Van | Full-Size Van | -8.3% |
| Car | Compact Car | -7.8% |
| Car | Sporty Car | -7.6% |
| Van | Compact Van | -6.1% |
| Pickup | Small Pickup | -5.3% |
| Average All Segments | -12.35% | |
| Average SUV/CUV/Crossovers | -14.69% | |
| Average Cars | -12.43% | |
| Average Van | -9.5% | |
| Average Trucks | -6.9% |
Year to Year Depreciation by Segment
Average Vehicle Depreciation Per Segment Type 2017 to 2018


