New-to-Used Vehicle Sales Ratio 2014-2018
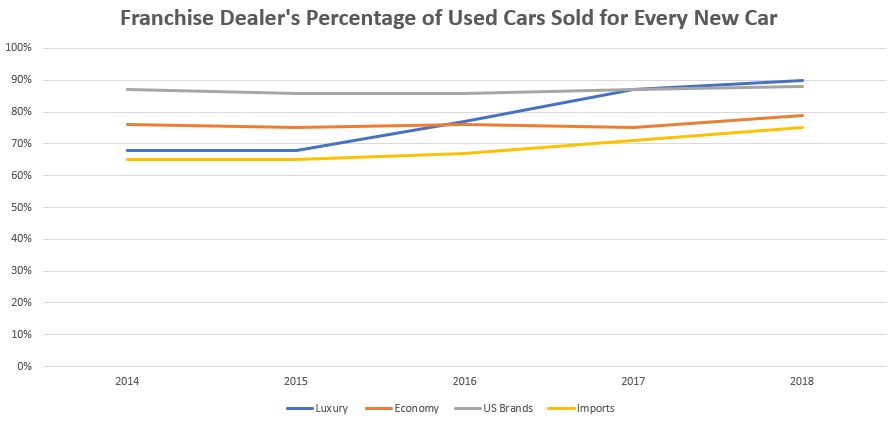
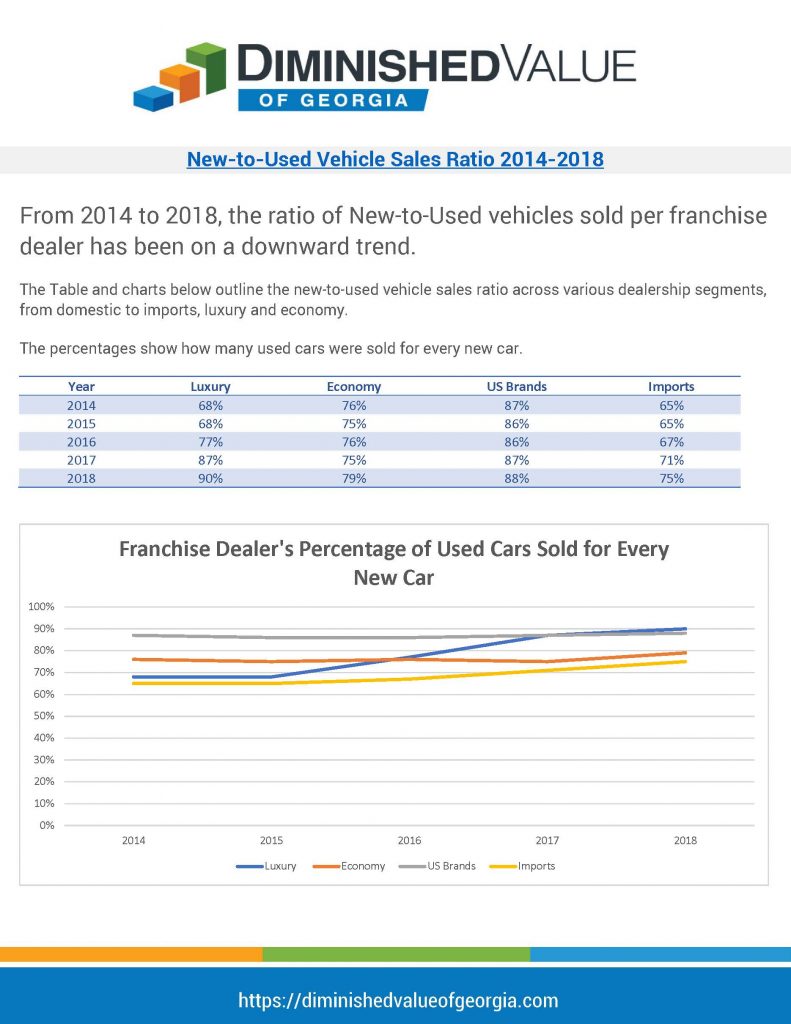
From 2014 to 2018, the ratio of New-to-Used vehicles sold per franchise dealer has been on a downward trend.
Franchise dealers are selling more used car now than 4 years ago.
Below are a few auto news headlines from the last few weeks. This shows new car dealers, especially luxury brands, are embracing used vehicle sales.
- Strong ratio of used to new sales pays off
Mullinax Automotive, the biggest retailer of Ford-brand certified pre-owned vehicles in the country, is honing its sales strategies and leveraging CPO programs to shine in used-to-new ratio for vehicle sales. - Luxury dealers reversing course on used
Heightened price competition and dwindling new car sales have luxury dealers turning to the used car market where there’s new financial opportunity. - Lamborghini launches pre-owned program
Lamborghini has launched what it is calling its first official certified pre-owned program, and one model gets looser qualifying criteria than others. - Another CPO sales record this year?
Affordability issues appear to be nudging more buyers into used cars and trucks.
The Table and charts below outline the new-to-used vehicle sales ratio across various dealership segments, from domestic to imports, luxury and economy.
The percentages show how many used cars were sold for every new car.
| Year | Luxury | Economy | US Brands | Imports |
| 2014 | 68% | 76% | 87% | 65% |
| 2015 | 68% | 75% | 86% | 65% |
| 2016 | 77% | 76% | 86% | 67% |
| 2017 | 87% | 75% | 87% | 71% |
| 2018 | 90% | 79% | 88% | 75% |


