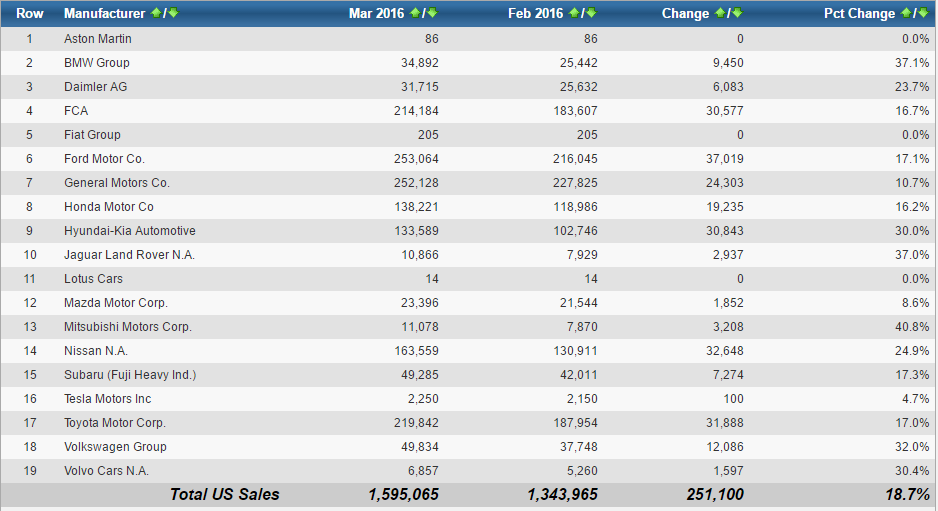
Automotive US Sales Report for March 2016
Row manufacturer Mar 2016 Feb 2016 #Change % Change
| 1 | Aston Martin | 86 | 86 | 0 | 0 |
| 2 | BMW Group | 34892 | 25442 | 9450 | 0.371 |
| 3 | Daimler AG | 31715 | 25632 | 6083 | 0.237 |
| 4 | FCA | 214184 | 183607 | 30577 | 0.167 |
| 5 | Fiat Group | 205 | 205 | 0 | 0 |
| 6 | Ford Motor Co. | 253064 | 216045 | 37019 | 0.171 |
| 7 | General Motors Co. | 252128 | 227825 | 24303 | 0.107 |
| 8 | Honda Motor Co | 138221 | 118986 | 19235 | 0.162 |
| 9 | Hyundai-Kia Automotive | 133589 | 102746 | 30843 | 0.3 |
| 10 | Jaguar Land Rover N.A. | 10866 | 7929 | 2937 | 0.37 |
| 11 | Lotus Cars | 14 | 14 | 0 | 0 |
| 12 | Mazda Motor Corp. | 23396 | 21544 | 1852 | 0.086 |
| 13 | Mitsubishi Motors Corp. | 11078 | 7870 | 3208 | 0.408 |
| 14 | Nissan N.A. | 163559 | 130911 | 32648 | 0.249 |
| 15 | Subaru (Fuji Heavy Ind.) | 49285 | 42011 | 7274 | 0.173 |
| 16 | Tesla Motors Inc | 2250 | 2150 | 100 | 0.047 |
| 17 | Toyota Motor Corp. | 219842 | 187954 | 31888 | 0.17 |
| 18 | Volkswagen Group | 49834 | 37748 | 12086 | 0.32 |
| 19 | Volvo Cars N.A. | 6857 | 5260 | 1597 | 0.304 |
| Total US Sales | 1595065 | 1343965 | 251100 | 0.187 | |


