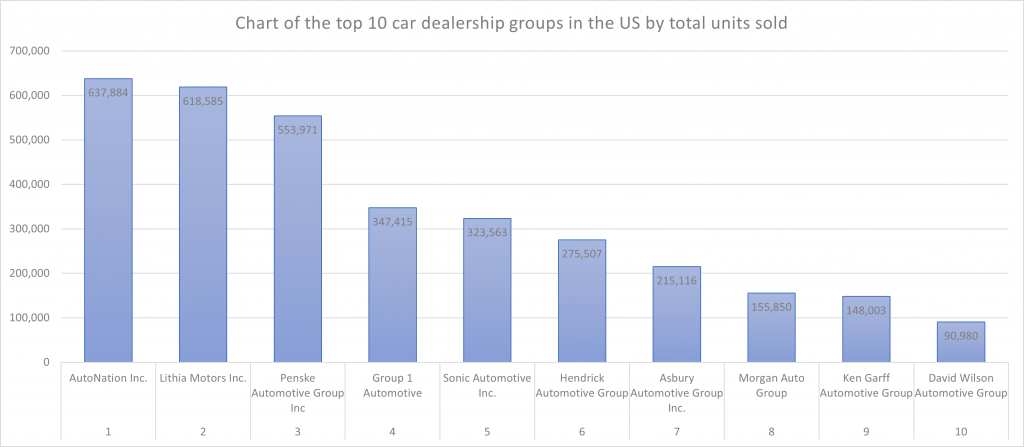
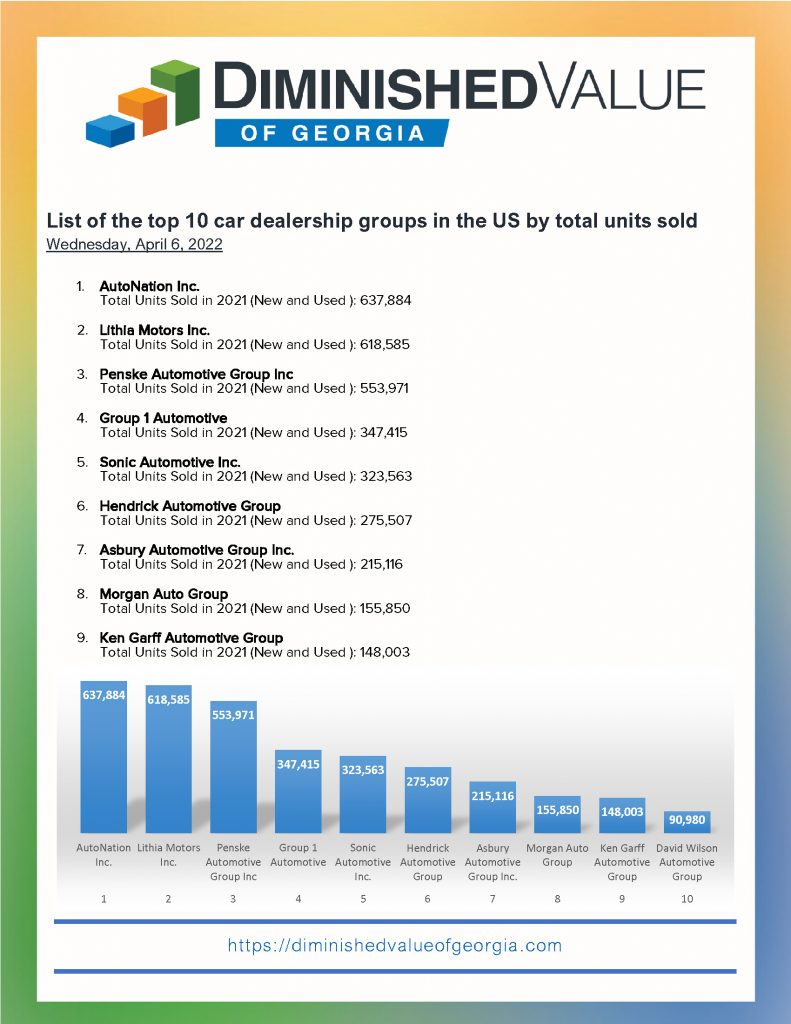
List of the top 10 car dealership groups in the US by total units sold (PDF)
- AutoNation Inc.
Total Units Sold in 2021 (New and Used ): 637,884 - Lithia Motors Inc.

Total Units Sold in 2021 (New and Used ): 618,585 - Penske Automotive Group Inc
Total Units Sold in 2021 (New and Used ): 553,971 - Group 1 Automotive
Total Units Sold in 2021 (New and Used ): 347,415 - Sonic Automotive Inc.
Total Units Sold in 2021 (New and Used ): 323,563 - Hendrick Automotive Group
Total Units Sold in 2021 (New and Used ): 275,507 - Asbury Automotive Group Inc.
Total Units Sold in 2021 (New and Used ): 215,116 - Morgan Auto Group
Total Units Sold in 2021 (New and Used ): 155,850 - Ken Garff Automotive Group
Total Units Sold in 2021 (New and Used ): 148,003 - David Wilson Automotive Group
Total Units Sold in 2021 (New and Used ): 90,980
List of the top 10 car dealership groups in the US by NEW units sold
- AutoNation Inc.
2020 Rank: 1
2021 Rank: 1
Total Units Sold in 2021 (New and Used ): 262,403 - Lithia Motors Inc.
2020 Rank: 3
2021 Rank: 2
Total Units Sold in 2021 (New and Used ): 260,738 - Penske Automotive Group Inc
2020 Rank: 2
2021 Rank: 3
Total Units Sold in 2021 (New and Used ): 195,384 - Group 1 Automotive
2020 Rank: 4
2021 Rank: 4
Total Units Sold in 2021 (New and Used ): 146,072 - Asbury Automotive Group Inc.
2020 Rank: 6
2021 Rank: 5
Total Units Sold in 2021 (New and Used ): 109,910 - Hendrick Automotive Group
2020 Rank: 5
2021 Rank: 6
Total Units Sold in 2021 (New and Used ): 103,949 - Sonic Automotive Inc.
2020 Rank: 7
2021 Rank: 7
Total Units Sold in 2021 (New and Used ): 103,486 - Morgan Auto Group
2020 Rank: 11
2021 Rank: 8
Total Units Sold in 2021 (New and Used ): 60,951 - Ken Garff Automotive Group
2020 Rank: 9
2021 Rank: 9
Total Units Sold in 2021 (New and Used ): 58,787 - David Wilson Automotive Group
2020 Rank: 10
2021 Rank: 10
Total Units Sold in 2021 (New and Used ): 50,425
List of the top 10 car dealer groups by the number of dealerships added in 2021
| Number of Car Dealerships | |||||
| Rank | Dealership group | in 2020 | in 2021 | added (+) | % Added |
| 1 | Asbury Automotive Group Inc | 91 | 162 | 71 | 78% |
| 2 | Lithia Motors Inc. | 209 | 278 | 69 | 33% |
| 3 | Sonic Automotive Inc. | 100 | 156 | 56 | 56% |
| 4 | Group 1 Automotive Inc. | 167 | 202 | 35 | 21% |
| 5 | Penske Automotive Group Inc. | 260 | 287 | 27 | 10% |
| 6 | AutoNation Inc. | 235 | 256 | 21 | 9% |
| 7 | Ken Garff Automotive Group | 50 | 61 | 11 | 22% |
| 8 | Bob Johnson Auto Group | 14 | 23 | 9 | 64% |
| 8 | Ed Morse Automotive Group | 20 | 29 | 9 | 45% |
| 10 | Morgan Auto Group | 45 | 53 | 8 | 18% |
| 10 | Keating Auto Group | 20 | 28 | 8 | 40% |
| 10 | Shottenkirk Automotive Group Inc. | 14 | 22 | 8 | 57% |


