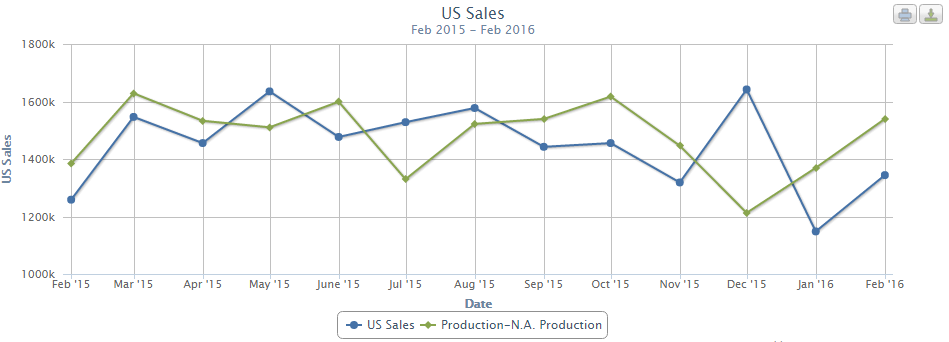
U.S. Automotive Production vs. Sales – 2015 to 2016.

U.S. Production vs. Sales.
| US Sales | US Production | ||
| Date | Value | Date | Value |
| Feb-15 | 1,258,515 | Feb-15 | 1,384,734 |
| Mar-15 | 1,546,465 | Mar-15 | 1,628,658 |
| Apr-15 | 1,455,471 | Apr-15 | 1,532,976 |
| May-15 | 1,635,199 | May-15 | 1,510,215 |
| Jun-15 | 1,476,719 | Jun-15 | 1,599,337 |
| Jul-15 | 1,528,168 | Jul-15 | 1,329,757 |
| Aug-15 | 1,577,418 | Aug-15 | 1,522,149 |
| Sep-15 | 1,442,366 | Sep-15 | 1,539,427 |
| Oct-15 | 1,455,369 | Oct-15 | 1,617,245 |
| Nov-15 | 1,318,448 | Nov-15 | 1,446,266 |
| Dec-15 | 1,641,968 | Dec-15 | 1,212,771 |
| Jan-16 | 1,148,150 | Jan-16 | 1,369,366 |
| Feb-16 | 1,343,965 | Feb-16 | 1,539,635 |


