Top 20 dealership groups in the U.S. ranked on 2018 body shop revenue
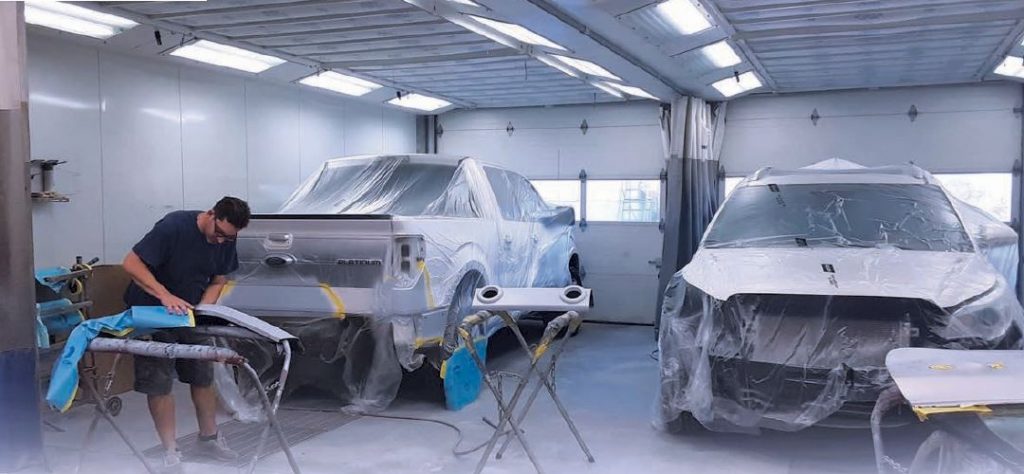
Collision Repair Market Share
Collision repair is a $36.2 billion-a-year business in the U.S. Body shops operated by car dealerships trailed both chain and franchised repair centers and independent
shops in their share of the U.S. collision market.
| Independent Collision Shops | Car Dealership Body Shops | Chain & Franchise Collision Shops |
| 54.1% Market Share | 19.3% Market Share | 26.6% Market Share |
Pros and Cons for new-vehicle dealers to operate a collision shop:
Pro: Automaker brand recognition reduces marketing expense and increases trust
Pro: Gross profit is ~ 45%
Pros: Cost to operate shop is dispersed across other dealer operations
Pros: Increased Cash flow from insurance work
Pros: Increased parts sales
Pros: Converting collision customers to new car buyers
Cons: Crashes are relatively infrequent and repairs differ, a collision business model can be hard to build.
Cons: Requires specialty tools and labor
Cons: Liability concerns if vehicles are improperly repaired
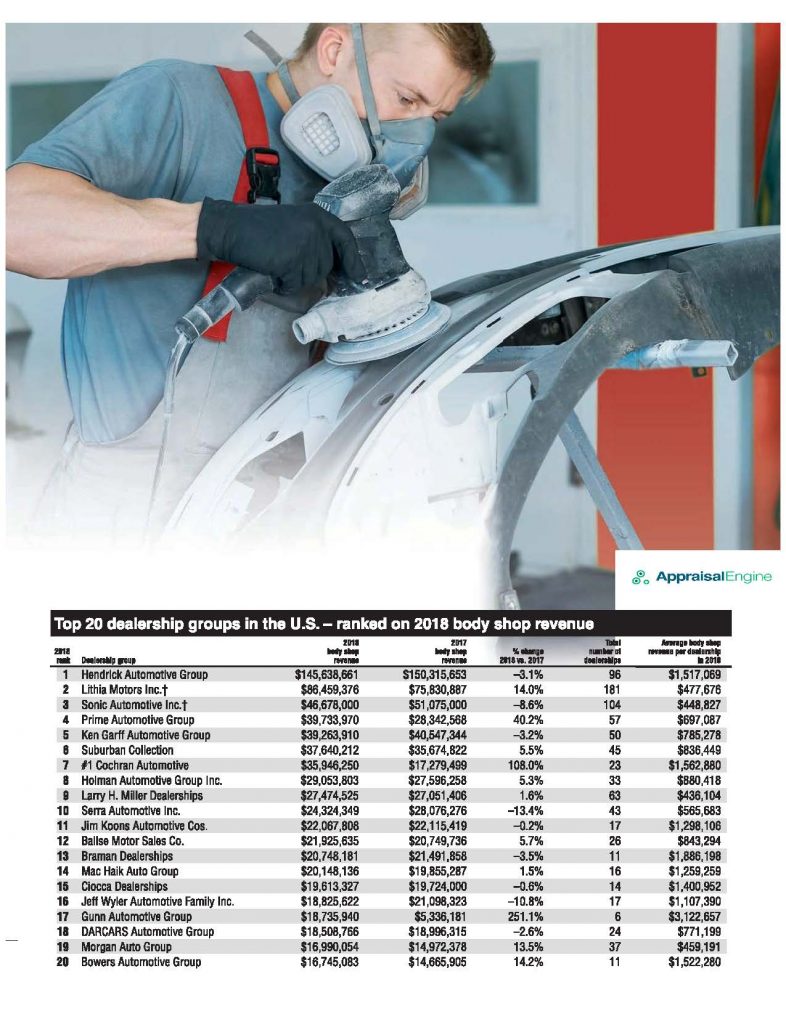
Top 20 dealership groups in the U.S. – ranked on 2018 body shop revenue & 2018 2017 Comparison
| Rank | Dealer Group | Collision Shop Revenue 2018 | Collision Shop Revenue 2017 | Difference | Number of Shops | Revenue Per Shop |
| 1 | Hendrick Automotive Group | $ 145,638,661 | $ 150,315,653 | -3.11% | 96 | $ 1,517,069 |
| 2 | Lithia Motors Inc | $ 86,459,376 | $ 75,830,887 | 14.02% | 181 | $ 477,676 |
| 3 | Sonic Automotive Inc | $ 46,678,000 | $ 51,075,000 | -8.61% | 104 | $ 448,827 |
| 4 | Prime Automotive Group | $ 39,733,970 | $ 28,342,568 | 40.19% | 57 | $ 697,087 |
| 5 | Ken Garff Automotive Group | $ 39,263,910 | $ 40,547,344 | -3.17% | 50 | $ 785,278 |
| 6 | Suburban Collection | $ 37,640,212 | $ 35,674,822 | 5.51% | 45 | $ 836,449 |
| 7 | Cochran Automotive | $ 35,946,250 | $ 17,279,499 | 108.03% | 23 | $ 1,562,880 |
| 8 | Holman Automotive Group Inc | $ 29,053,803 | $ 27,596,258 | 5.28% | 33 | $ 880,418 |
| 9 | Larry H. Miller Dealerships | $ 27,474,525 | $ 27,051,406 | 1.56% | 63 | $ 436,104 |
| 10 | Serra Automotive Inc | $ 24,324,349 | $ 28,076,276 | -13.36% | 43 | $ 565,683 |
| 11 | Jim Koons Automotive Cos | $ 22,067,808 | $ 22,115,419 | -0.22% | 17 | $ 1,298,106 |
| 12 | Balise Motor Sales Co | $ 21,925,635 | $ 20,749,736 | 5.67% | 26 | $ 843,294 |
| 13 | Braman Dealerships | $ 20,748,181 | $ 21,491,858 | -3.46% | 11 | $ 1,886,198 |
| 14 | Mac Haik Auto Group | $ 20,148,136 | $ 19,855,287 | 1.47% | 16 | $ 1,259,259 |
| 15 | Ciocca Dealerships | $ 19,613,327 | $ 19,724,000 | -0.56% | 14 | $ 1,400,952 |
| 16 | Jeff Wyler Automotive Family Inc | $ 18,825,622 | $ 21,098,323 | -10.77% | 17 | $ 1,107,390 |
| 17 | Gunn Automotive Group | $ 18,735,940 | $ 5,336,181 | 251.11% | 6 | $ 3,122,657 |
| 18 | DARCARS Automotive Group | $ 18,508,766 | $ 18,996,315 | -2.57% | 24 | $ 771,199 |
| 19 | Morgan Auto Group | $ 16,990,054 | $ 14,972,378 | 13.48% | 37 | $ 459,191 |
| 20 | Bowers Automotive Group | $ 16,745,083 | $ 14,665,905 | 14.18% | 11 | $ 1,522,280 |
0 Links
0 Links

