Daily Car News Bulletin for July 1, 2016
-
Tesla Model S Crash

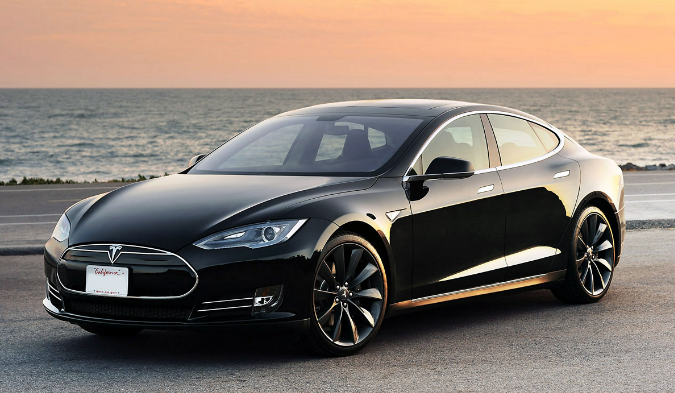
NHTSA investigates fatal crash of 2015 Tesla Model S in Autopilot mode. NHTSA spokesman said the agency’s preliminary evaluation would examine the design and performance of the Model S’ automated driving system and whether a defects exists. A police report says that the Model S went under the trailer of a truck that turned left in front of the car. The roof of the Model S was torn off, and the car kept going turning off the road until finally hitting utility pole about 100 feet away.
-
Volkswagen Wants to Repair All Defective Vehicles

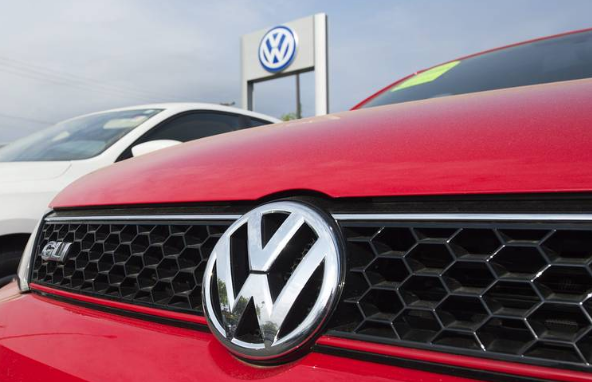
Volkswagen’s lawyer said during a court hearing that the German automaker believes it can fix 85,000 polluting 3.0-liter Volkswagen, Audi and Porsche diesel cars and SUVs, a plan that could help the company avoid a very expensive buyback. Earlier this week, Volkswagen agreed to pay up to $10.033 billion to buy back 475,000 vehicles that emit up to 40 times the allowed level of pollution. Volkswagen also agreed to spend $4.7 billion on zero-emission vehicle efforts and diesel offset programs.
-
Elio Motors

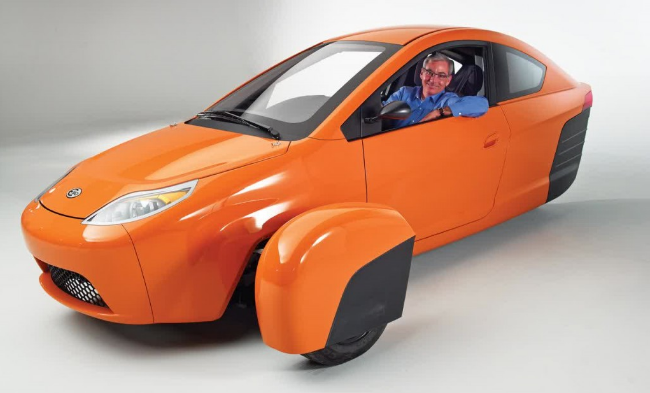
Elio Motors today provided a look at its first test of three-wheeled vehicle before the planned 2017 launch. After testing Elio announced starting price at $6,800 and max speed up to 84 mpg, in 2017. Elio, which initially planned to begin production in 2014, plans annual production volume at least 250,000 units in 2017.
-
June U.S. Sales
| Automaker | June 2016 | June 2015 | % change | 6 months 2016 |
6 months 2015 |
% change |
| BMW | – | – | –% | – | – | –% |
| Mini | – | – | –% | – | – | –% |
| Rolls-Royce* | – | – | –% | – | – | –% |
| BMW of N.A. | – | – | –% | – | – | –% |
| Alfa Romeo | 36 | 25 | 44.0% | 309 | 320 | –3.4% |
| Chrysler | 24,747 | 30,809 | –19.7% | 137,372 | 170,248 | –19.3% |
| Dodge | 44,819 | 43,457 | 3.1% | 271,740 | 257,142 | 5.7% |
| Fiat | 2,544 | 3,137 | –18.9% | 17,735 | 21,798 | –18.6% |
| Jeep | 83,691 | 71,529 | 17.0% | 468,131 | 401,689 | 16.5% |
| Ram | 41,236 | 36,078 | 14.3% | 256,972 | 230,946 | 11.3% |
| FCA US | 197,073 | 185,035 | 6.5% | 1,152,259 | 1,082,143 | 6.5% |
| Maserati | 941 | 974 | –3.4% | 5,199 | 5,304 | –2.0% |
| Fiat Chrysler Automobiles** | 198,014 | 186,009 | 6.5% | 1,157,458 | 1,087,447 | 6.4% |
| Ford | 230,287 | 216,355 | 6.4% | 1,291,873 | 1,241,207 | 4.1% |
| Lincoln | 8,809 | 8,326 | 5.8% | 53,297 | 47,112 | 13.1% |
| Ford Motor Co. | 239,096 | 224,681 | 6.4% | 1,345,170 | 1,288,319 | 4.4% |
| Buick | 16,575 | 17,531 | –5.5% | 104,207 | 106,314 | –2.0% |
| Cadillac | 14,263 | 13,515 | 5.5% | 73,231 | 80,899 | –9.5% |
| Chevrolet | 181,387 | 181,256 | 0.1% | 1,006,890 | 1,053,619 | –4.4% |
| GMC | 42,985 | 47,051 | –8.6% | 254,587 | 264,713 | –3.8% |
| General Motors | 255,210 | 259,353 | –1.6% | 1,438,915 | 1,505,545 | –4.4% |
| Acura | 11,352 | 15,527 | –26.9% | 78,994 | 87,087 | –9.3% |
| Honda | 127,363 | 118,870 | 7.1% | 713,361 | 665,914 | 7.1% |
| Honda Motor Co. | 138,715 | 134,397 | 3.2% | 792,355 | 753,001 | 5.2% |
| Hyundai | – | – | –% | – | – | –% |
| Kia | – | – | –% | – | – | –% |
| Hyundai-Kia | – | – | –% | – | – | –% |
| Jaguar | – | – | –% | – | – | –% |
| Land Rover | – | – | –% | – | – | –% |
| Jaguar Land Rover N.A. | – | – | –% | – | – | –% |
| Mazda N.A. | 26,188 | 27,223 | –3.8% | 145,354 | 158,995 | –8.6% |
| Mercedes-Benz | – | – | –% | – | – | –% |
| Smart USA | – | – | –% | – | – | –% |
| Mercedes-Benz USA | – | – | –% | – | – | –% |
| Mitsubishi Motors N.A. | – | – | –% | – | – | –% |
| Infiniti | 11,058 | 9,985 | 10.7% | 64,978 | 64,280 | 1.1% |
| Nissan | 129,495 | 114,243 | 13.4% | 733,136 | 672,203 | 9.1% |
| Nissan North America | 140,553 | 124,228 | 13.1% | 798,114 | 736,483 | 8.4% |
| Subaru of America | 46,598 | 44,335 | 5.1% | 279,458 | 272,418 | 2.6% |
| Tesla Motors* | 2,250 | 2,100 | 7.1% | 13,225 | 12,600 | 5.0% |
| Lexus | 25,779 | 26,121 | –1.3% | 151,564 | 158,848 | –4.6% |
| Scion | 6,179 | 3,838 | 61.0% | 37,720 | 24,931 | 51.3% |
| Toyota | 166,299 | 179,953 | –7.6% | 1,008,516 | 1,047,661 | –3.7% |
| Toyota/Scion | 172,478 | 183,791 | –6.2% | 1,046,236 | 1,072,592 | –2.5% |
| Toyota Motor Sales U.S.A. | 198,257 | 209,912 | –5.6% | 1,197,800 | 1,231,440 | –2.7% |
| Volvo Car USA | – | – | –% | – | – | –% |
| Audi | 18,445 | 18,262 | 1.0% | 96,934 | 93,615 | 3.5% |
| Bentley | 144 | 223 | –35.4% | 628 | 1,249 | –49.7% |
| Lamborghini* | 86 | 84 | 2.4% | 516 | 504 | 2.4% |
| Porsche | – | – | –% | – | – | –% |
| VW | – | – | –% | – | – | –% |
| VW Group of America | 18,675 | 18,569 | 0.6% | 98,078 | 95,368 | 2.8% |
| Other | 305 | 298 | 2.3% | 1,830 | 1,788 | 2.3% |
| Total | 1,263,861 | 1,231,105 | 2.7% | 7,267,757 | 7,143,404 | 1.7% |


