What is Negative Equity when it comes to an Auto Loan?
Negative Equity also called “Upside down”, is a situation that occurs when a consumer owes more on his vehicle’s loan than the vehicle is worth.
Example:
2018 Honda Accord
Actual Cash Value = $18,500
Balance Owed on Loan = $21,000
Equity = – $2,500 (Negative)
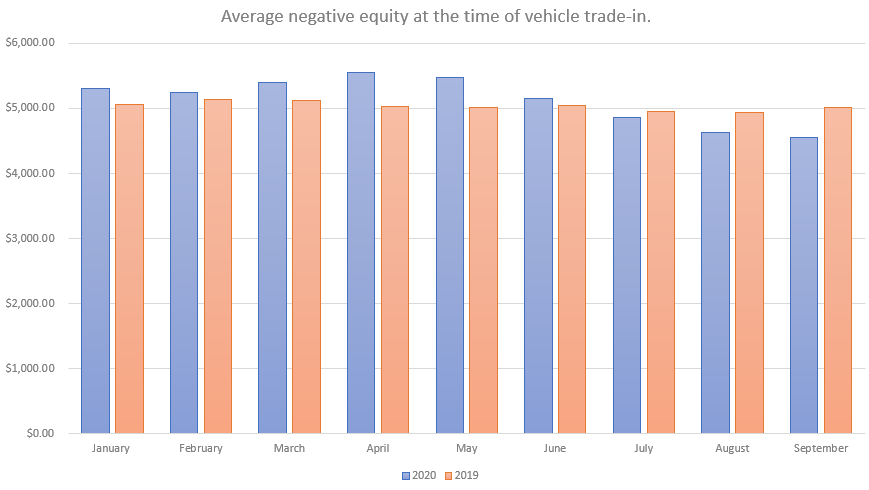
The average negative equity on vehicle trades has been rising steadily for years, reaching a record high in April 2020 at $5,035. This is due in-part to very long finance terms (60 months, 72 months, and 84 months).
Negative Equity Comparison 2019 V 2020
The table below shows the average negative equity amount as recorded by dealers at the time of trade-in.
| 2020 | 2019 | Change | ||
| January | $5,312.40 | $5,059.11 | $253.29 | 5.0% |
| February | $5,252.34 | $5,136.54 | $115.80 | 2.3% |
| March | $5,404.76 | $5,115.73 | $289.03 | 5.6% |
| April | $5,554.94 | $5,035.85 | $519.09 | 10.3% |
| May | $5,472.24 | $5,019.67 | $452.57 | 9.0% |
| June | $5,157.45 | $5,048.75 | $108.70 | 2.2% |
| July | $4,860.32 | $4,952.16 | ($91.84) | -1.9% |
| August | $4,628.31 | $4,930.99 | ($302.68) | -6.1% |
| September | $4,559.46 | $5,019.47 | ($460.01) | -9.2% |

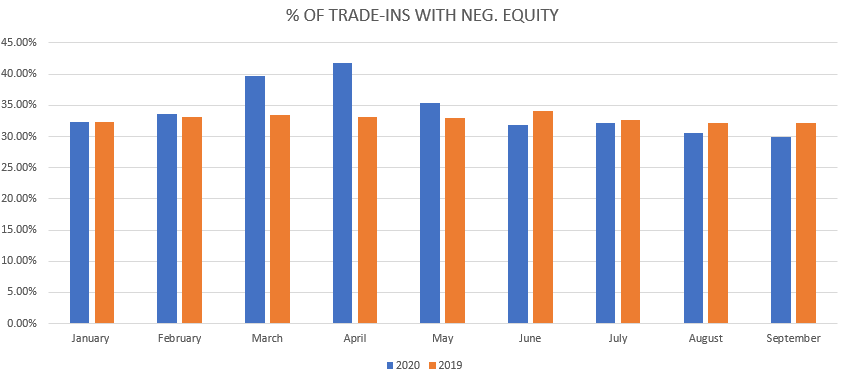
The table below shows the percentage of trade-in transactions where the car seller has negative equity.
| 2020 | 2019 | Change | |
| January | 32.40% | 32.40% | 0.00% |
| February | 33.60% | 33.20% | 0.40% |
| March | 39.70% | 33.40% | 6.30% |
| April | 41.80% | 33.10% | 8.70% |
| May | 35.40% | 32.90% | 2.50% |
| June | 31.90% | 34.10% | -2.20% |
| July | 32.20% | 32.60% | -0.40% |
| August | 30.60% | 32.10% | -1.50% |
| September | 29.90% | 32.10% | -2.20% |


