Automotive Market Insights September 2020
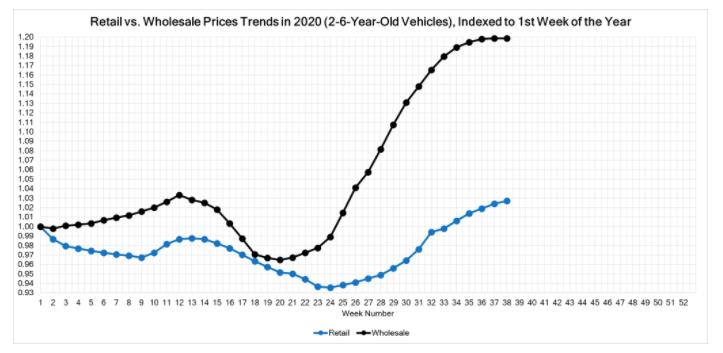
- Wholesale prices showed declines with the overall average market experiencing a negative adjustment. Full-Size Trucks continued to see strong prices for a 17th week in a row.
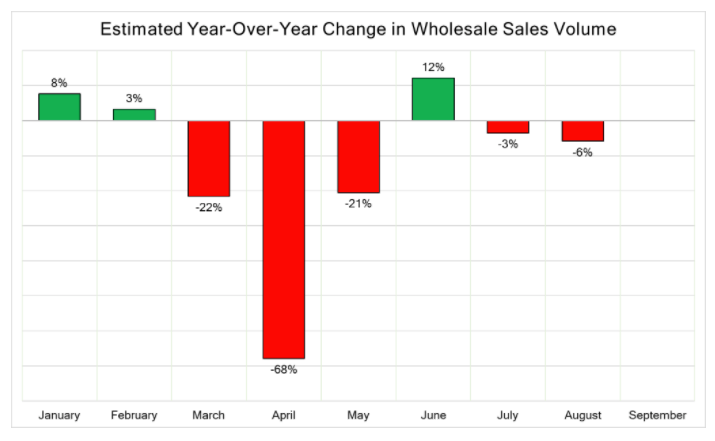
- Overall wholesale sold volume was below 2019 levels, but the performance of different channels varied with some overperforming versus the previous year.
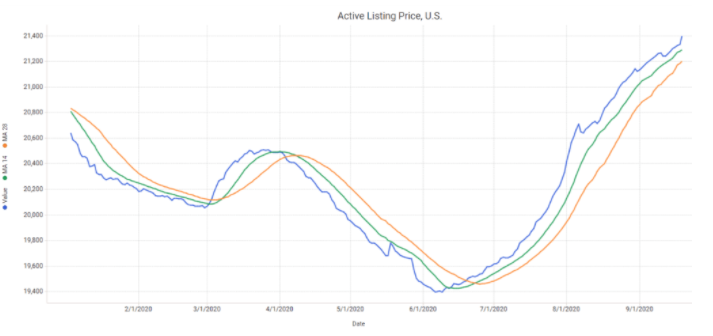
- Retail listing prices increased again, currently 3% above where we started in January.
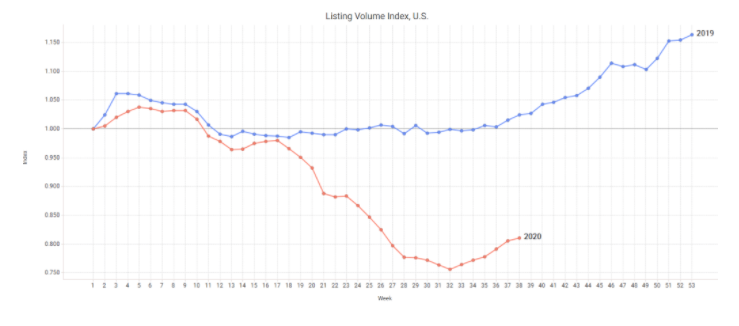
- Used retail listing volume continued to increase but remains at levels much lower than last year – about 6% below a year ago and 19% below where we started a year.
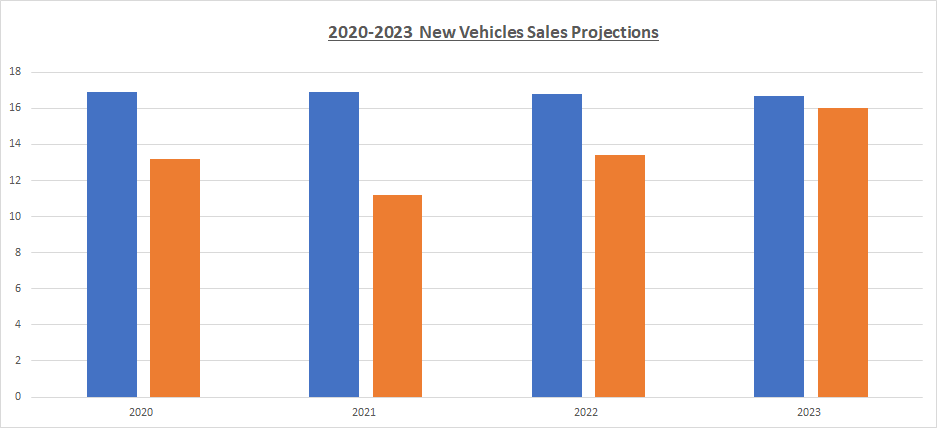
2020-2023 New Vehicles Sales Projections
| Year | Pre-COVID Projections | Post-COVID Projection | Reduction |
| 2019 | Vehicles Sold = 17.0 Million New Cars | ||
| 2020 | 16.9 Million | 13.2 Million | 3.7 Million |
| 2021 | 16.9 Million | 11.2 Million | 5.7 Million |
| 2022 | 16.8 Million | 13.4 Million | 3.4 Million |
| 2023 | 16.7 Million | 16.0 Million | 0.7 Million |
Market Insights Graphs and Charts
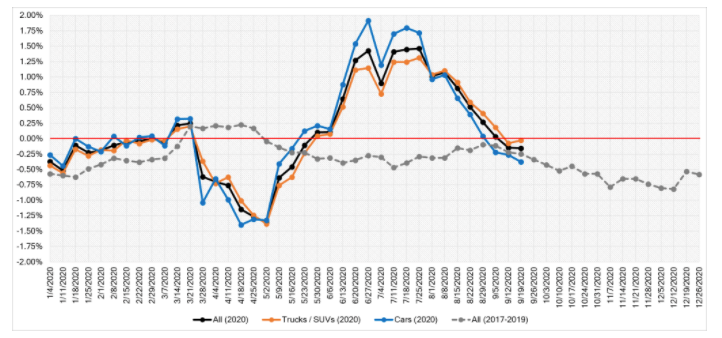
The graph below shows week-over-week depreciation rates for the entire market, including Cars and Trucks/SUVs/Vans for the last several months.
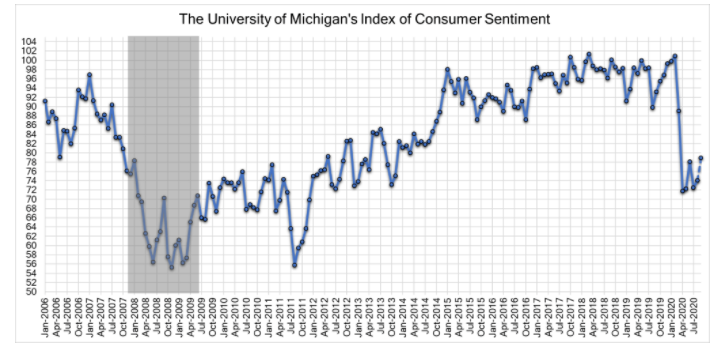
The graph below shows consumer confidence from 2006 to 2020
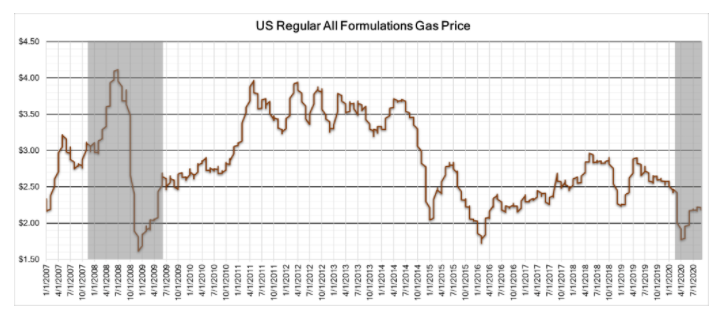
The graph below shows gasoline prices from 2007 to 2020
The graph below shows the wholesale sold volume decrease in 2020
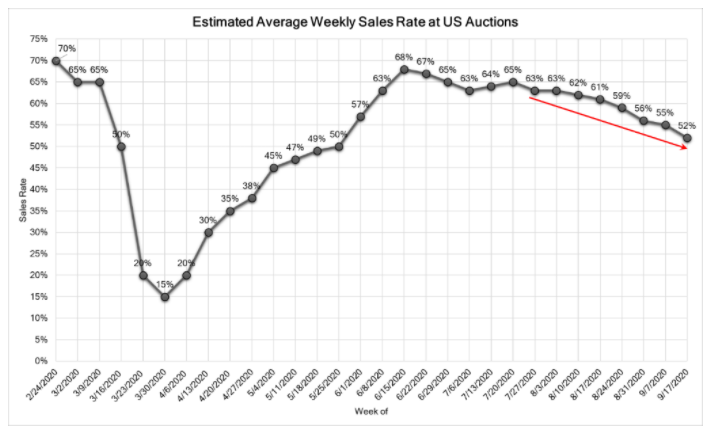
The graph below shows the Weekly Average Sales rate Feb to Sept 2020
The graph below shows the increase in used retail prices fueled by higher consumer demand starting July 2020
The graph below shows the weekly Used Retail Inventory in 2020 versus 2019
Used Retail vs. Wholesale Prices Trends
