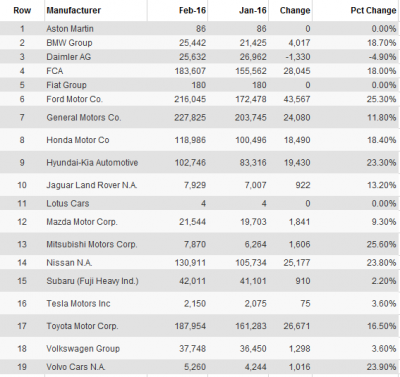
Automotive Market US Sales Report for February 2016

| Row | Manufacturer | Feb-16 | Jan-16 | Change | Percent Change |
| 1 | Aston Martin | 86 | 86 | 0 | 0.00% |
| 2 | BMW Group | 25,442 | 21,425 | 4,017 | 18.70% |
| 3 | Daimler AG | 25,632 | 26,962 | -1,330 | -4.90% |
| 4 | FCA | 183,607 | 155,562 | 28,045 | 18.00% |
| 5 | Fiat Group | 180 | 180 | 0 | 0.00% |
| 6 | Ford Motor Co. | 216,045 | 172,478 | 43,567 | 25.30% |
| 7 | General Motors Co. | 227,825 | 203,745 | 24,080 | 11.80% |
| 8 | Honda Motor Co | 118,986 | 100,496 | 18,490 | 18.40% |
| 9 | Hyundai-Kia Automotive | 102,746 | 83,316 | 19,430 | 23.30% |
| 10 | Jaguar Land Rover N.A. | 7,929 | 7,007 | 922 | 13.20% |
| 11 | Lotus Cars | 4 | 4 | 0 | 0.00% |
| 12 | Mazda Motor Corp. | 21,544 | 19,703 | 1,841 | 9.30% |
| 13 | Mitsubishi Motors Corp. | 7,870 | 6,264 | 1,606 | 25.60% |
| 14 | Nissan N.A. | 130,911 | 105,734 | 25,177 | 23.80% |
| 15 | Subaru (Fuji Heavy Ind.) | 42,011 | 41,101 | 910 | 2.20% |
| 16 | Tesla Motors Inc | 2,150 | 2,075 | 75 | 3.60% |
| 17 | Toyota Motor Corp. | 187,954 | 161,283 | 26,671 | 16.50% |
| 18 | Volkswagen Group | 37,748 | 36,450 | 1,298 | 3.60% |
| 19 | Volvo Cars N.A. | 5,260 | 4,244 | 1,016 | 23.90% |
| Total US Sales | 1,343,930 | 1,148,115 | 195,815 | 17.10% | |


