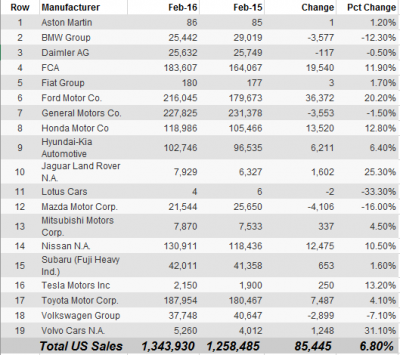
Automotive Market Year over Year US Sales Report

| Row | Manufacturer | Feb-16 | Feb-15 | Change | Pct Change |
| 1 | Aston Martin | 86 | 85 | 1 | 1.20% |
| 2 | BMW Group | 25,442 | 29,019 | -3,577 | -12.30% |
| 3 | Daimler AG | 25,632 | 25,749 | -117 | -0.50% |
| 4 | FCA | 183,607 | 164,067 | 19,540 | 11.90% |
| 5 | Fiat Group | 180 | 177 | 3 | 1.70% |
| 6 | Ford Motor Co. | 216,045 | 179,673 | 36,372 | 20.20% |
| 7 | General Motors Co. | 227,825 | 231,378 | -3,553 | -1.50% |
| 8 | Honda Motor Co | 118,986 | 105,466 | 13,520 | 12.80% |
| 9 | Hyundai-Kia Automotive | 102,746 | 96,535 | 6,211 | 6.40% |
| 10 | Jaguar Land Rover N.A. | 7,929 | 6,327 | 1,602 | 25.30% |
| 11 | Lotus Cars | 4 | 6 | -2 | -33.30% |
| 12 | Mazda Motor Corp. | 21,544 | 25,650 | -4,106 | -16.00% |
| 13 | Mitsubishi Motors Corp. | 7,870 | 7,533 | 337 | 4.50% |
| 14 | Nissan N.A. | 130,911 | 118,436 | 12,475 | 10.50% |
| 15 | Subaru (Fuji Heavy Ind.) | 42,011 | 41,358 | 653 | 1.60% |
| 16 | Tesla Motors Inc | 2,150 | 1,900 | 250 | 13.20% |
| 17 | Toyota Motor Corp. | 187,954 | 180,467 | 7,487 | 4.10% |
| 18 | Volkswagen Group | 37,748 | 40,647 | -2,899 | -7.10% |
| 19 | Volvo Cars N.A. | 5,260 | 4,012 | 1,248 | 31.10% |
| Total US Sales | 1,343,930 | 1,258,485 | 85,445 | 6.80% | |


