Wholesale Prices: Week Ending July 6, 2024
June is already gone! First things first, we hope you had an awesome 4th of July!
But now it is time to get back into business.
Download the Auto Market Update July 2024 – Week 1 PDF
Zooming in the Decline
There was no stop for the depreciation trend seen in June, keeping up into the first week of July.
This week the auto market declined -0.47%. A better number than last week’s -0.51%.
The July 4th holiday slowed the weekend auctions.
Even though the range of 50% average conversion rate is still on.
| Week Ending | Car Segments | Truck & SUV Segments | Overall Market |
|---|---|---|---|
| July 6, 2024 | -0.62% | -0.42% | -0.47% |
| Previous Week | -0.53% | -0.50% | -0.51% |
| 2017-2019 Average | -0.30% | -0.15% | -0.21% |
Week Over Week Wholesale Price Changes
2-to-8-year-old vehicles


Car Segment: Down the Rabbit Hole
Using only volume as a metric, the car segment saw a decrease of -0.62%.
In the previous week, it was -0.53%
While the 0-to-2-year-old car niche faced -0.39%, the 8-to-16-year-old vehicles got -0.25%.
Bad declines were a reality for all the 9 car branches.
The worst decline was in the Compact Cars slice:
A surprising -1.09% decline in a single week!
The worst result since December 2023!
Even the 8-to-6-year-old sports car got in this mess.
This segment has not seen a decline since February.
Until last week.
With a drop of only -0.11%, the award of the smallest decline goes to…
The Premium Sporty Cars niche!

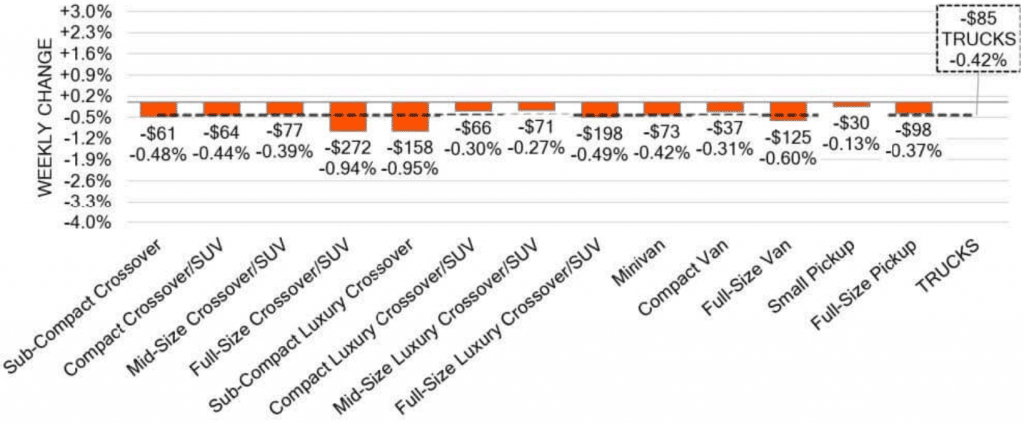
Truck Segment: The Harder They Fall
In sales volume, the truck niche saw a -0.42% decrease.
A better state than last week’s -0.50%.
Trucks of the last 2 years got a -0.33% decrease, while the 8-to-6-year gap faced a -0.26%.
Again, all 13 segments were struck by this first week’s decline.
As new incentives arrive to the Full-Size Trucks, used models face heavy pressure.
This a -0.68% decline rate for the 2nd week in a row.
A huge fall compared to 3 weeks ago, when this number was only -0.36%.
On the other end of the spectrum, Small Pickups see a +0.40% increase.
The worst performance was on the Sub-Compact Luxury slice.
A incredible drop of -0.95%!
Wholesale Weekly Price Index
The graph below looks at trends in wholesale prices of 2- to 6-year-old vehicles.
Indexed to the first week of the year.
To compute the index, keep the average age of the mix constant to identify market movements.
Wholesale Weekly Price Index
2-6–Year-Old Vehicles

Used Retail Price Index
The increase in “no-haggle pricing” in retail made it more accessible than in past years.
Price transparency made car buying more delightful and measurable.
This graph shows 2-to-6-year-old vehicles.
Analyzing almost 2 million listed for sale vehicles on U.S dealer lots.
To compute the index, the average age of the mix was a constant.
This way market movements are identified with precision.
Used Retail Price Index
2-6-Year-Old Vehicles

Already Winter in the Used Autos Retail Market?
Used Retail Active Listing Volume
How many days it takes for a dealer to sell a used vehicle?
An inventory analysis of most of the dealerships supports the index.
To identify market changes, the first week of the year is the standard.
The estimated Used Retail Days-to-Turn is rising.
Now at 48 days!

Sales Rate
Last week we celebrated the Independence Day holiday!
We hope you spent quality time with your family and friends.
Cars and Truck markets keep declining.
We’ll get into the 6th week of constant declines in the car segment…
And in the 7th for the Trucks!
The difficulties and challenges have never been so underlined in the auto field.
But even with the holiday break, auctions keep rising.
The conversion rates in auctions had an incredible 1% boost last week reaching 58%!


