Understanding vehicle depreciation is crucial for anyone involved in buying, owning, or selling vehicles. Depreciation impacts a car’s value over time, affecting insurance rates, resale prices, and overall costs of ownership.
In 2024, several market trends are influencing vehicle depreciation, shedding light on how different factors play a role in this process. This article examines the main insights from the 2024 vehicle depreciation report, providing a thorough analysis of trends, data, and strategies to help manage and mitigate depreciation.
1. Key Market Trends Influencing Vehicle Depreciation in 2024
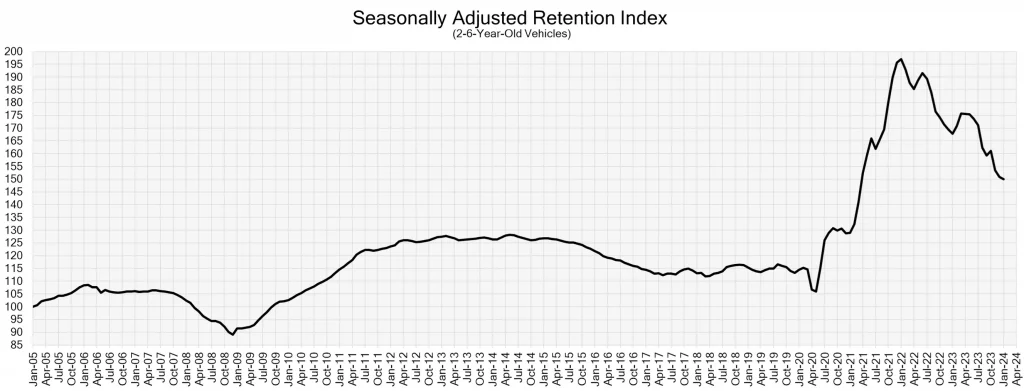
The 2024 vehicle depreciation report highlights several market trends that significantly impact vehicle depreciation rates. Economic factors, supply and demand dynamics, and advancements in vehicle technology are among the primary influencers.
Economic Factors
Various economic variables, such as interest rates, inflation, and consumer purchasing power, significantly influence vehicle depreciation. Increased interest rates result in higher borrowing costs, thereby diminishing consumers’ buying power and potentially decreasing vehicle sales and values. Additionally, inflation impacts the market by raising the prices of new vehicles, which in turn accelerates the depreciation of older models.
Supply and Demand Dynamics
The equilibrium between supply and demand is another vital factor influencing vehicle depreciation. In 2024, the vehicle market has faced inventory fluctuations due to manufacturing and supply chain disruptions.
An excess of available vehicles can increase depreciation rates. This has been observed with electric vehicles (EVs), where rapid market expansion sometimes surpasses demand, leading to steeper depreciation.
2. Depreciation Rates Across Different Vehicle Segments
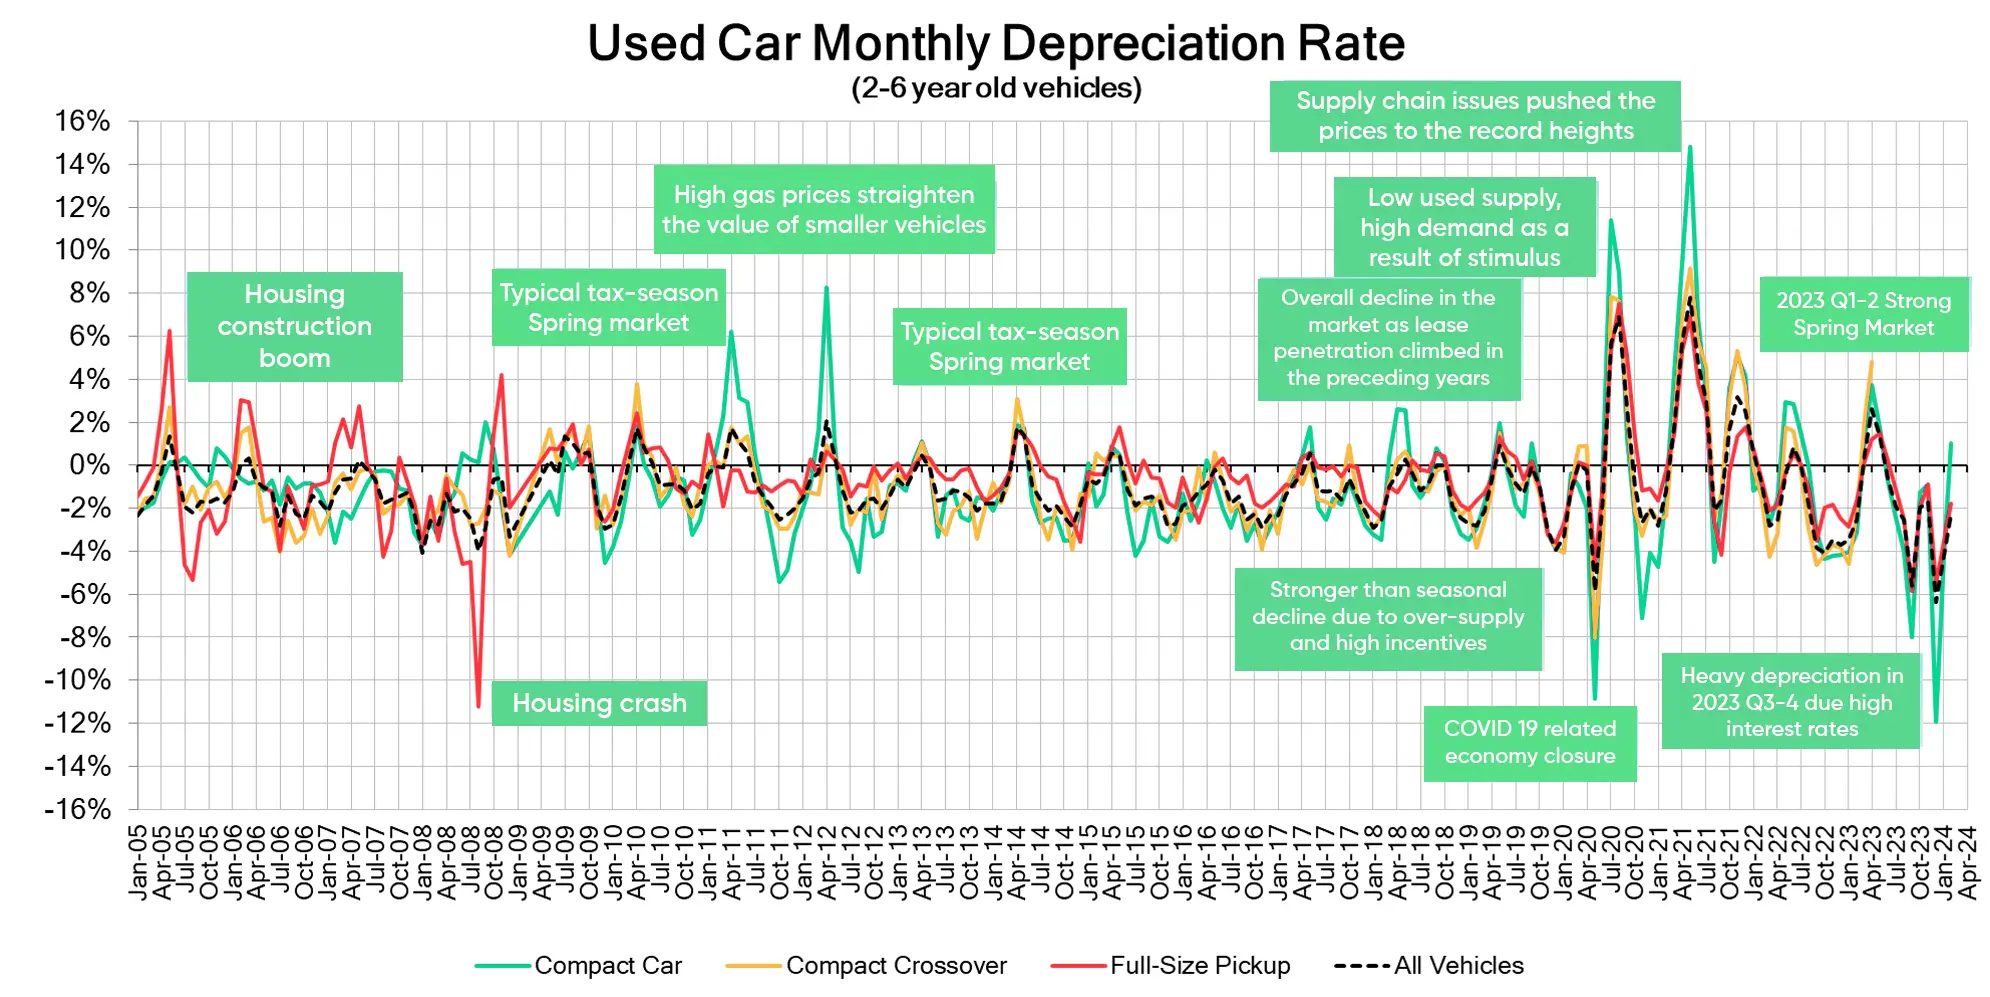
Depreciation rates vary significantly across different vehicle segments. Understanding these variations can help consumers and industry players make informed decisions.
Comparison of Depreciation Rates
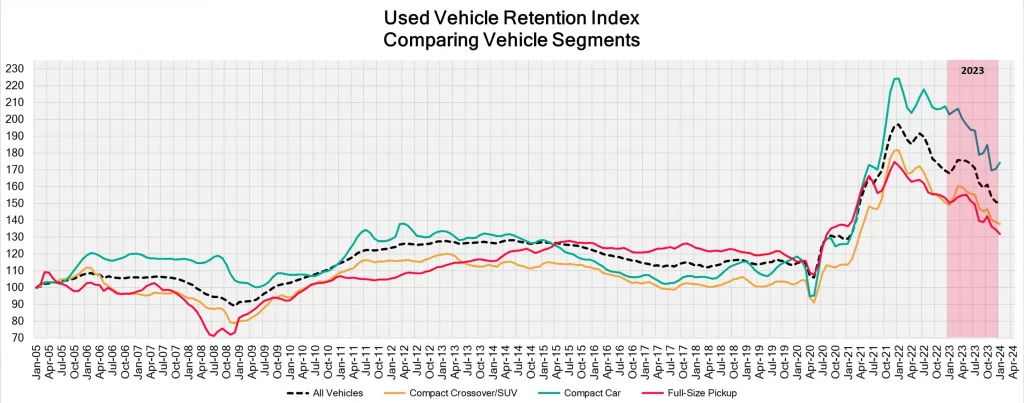
The 2024 report shows that compact cars, SUVs, and trucks have different depreciation profiles. Compact cars often depreciate faster due to lower demand compared to larger vehicles. SUVs and trucks, on the other hand, tend to retain their value better, partly because of their popularity and utility.
Factors Contributing to Differences
Several factors contribute to these differences, including market demand, vehicle utility, and economic conditions. For instance, the popularity of SUVs and trucks for both personal and commercial use helps maintain their value better than compact cars.
Table: Depreciation Rates by Vehicle Segment
| Vehicle Segment | Depreciation Rate (%) |
|---|---|
| Compact Cars | 25 |
| SUVs | 18 |
| Trucks | 15 |
Detailed Depreciation Rates
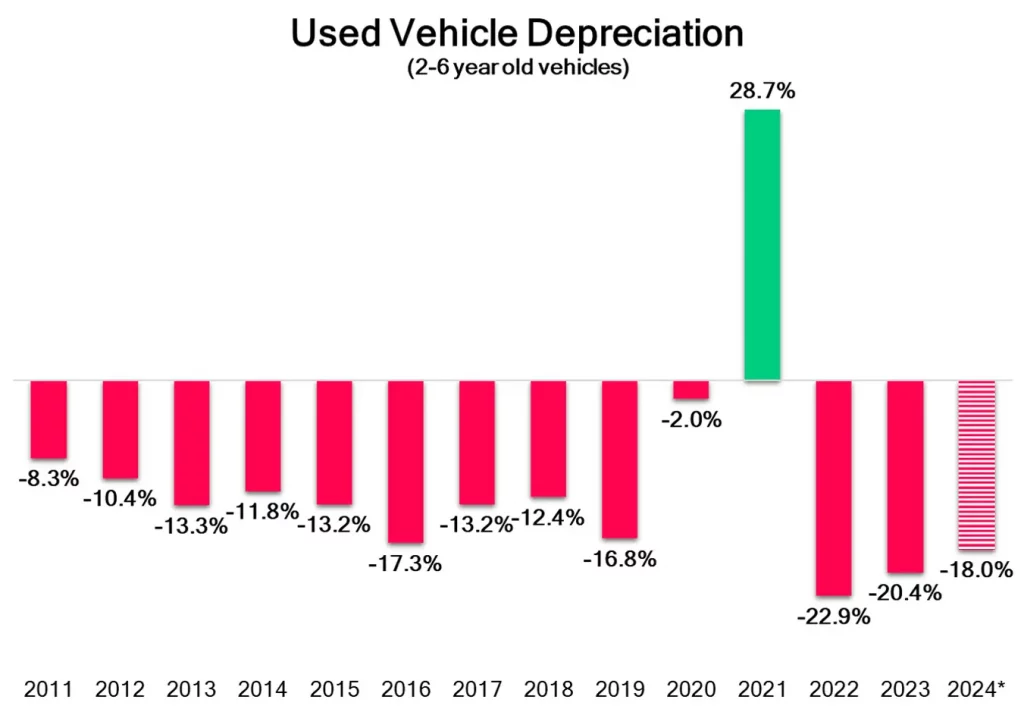
The table below from the 2024 vehicle depreciation report provides a more granular view of how different vehicle types depreciated across the four quarters of 2023:
| Vehicle Segment | Q1 | Q2 | Q3 | Q4 | Full Year |
|---|---|---|---|---|---|
| All Vehicles | 0.6% | -1.0% | -9.8% | -11.8% | -20.4% |
| Compact Car | 1.8% | -1.5% | -12.7% | -16.3% | -26.1% |
| Full-Size Car | 3.2% | 0.9% | -12.8% | -15.9% | -23.2% |
| Luxury Car | -3.2% | -2.0% | -8.9% | -11.5% | -23.4% |
| Mid-Size Car | 2.6% | -0.1% | -10.2% | -11.9% | -18.1% |
| Near Luxury Car | -2.6% | -1.4% | -10.7% | -10.1% | -22.3% |
| Premium Sporty Car | -3.6% | -1.8% | -3.1% | 5.6% | -12.9% |
| Prestige Luxury Car | -9.5% | -4.9% | -7.2% | -0.9% | -26.3% |
| Sporty Car | 3.7% | 2.9% | -10.2% | -17.1% | -20.4% |
| Sub-Compact Car | 0.4% | 1.9% | -11.0% | -11.8% | -18.4% |
| Compact Crossover/SUV | 4.6% | -1.4% | -10.0% | -12.3% | -18.7% |
| Compact Luxury CUV/SUV | -2.1% | -3.1% | -10.7% | -12.5% | -24.5% |
| Compact Van | -6.3% | -4.1% | -7.8% | -18.6% | -31.7% |
| Full-Size Crossover/SUV | -0.4% | -2.3% | -8.8% | -14.0% | -22.1% |
| Full-Size Luxury CUV/SUV | 0.7% | -2.3% | -10.9% | -11.9% | -24.2% |
| Full-Size Pickup | -0.2% | 1.0% | -9.9% | -9.8% | -18.9% |
| Full-Size Van | -2.6% | -3.7% | -6.3% | -12.9% | -23.1% |
| Mid-Size Crossover/SUV | 1.0% | 2.1% | -10.5% | -11.8% | -19.9% |
| Mid-Size Luxury CUV/SUV | -1.1% | -3.1% | -10.5% | -8.5% | -23.8% |
| Minivan | 3.4% | 4.0% | -1.6% | -10.9% | -12.3% |
| Small Pickup | 2.2% | 1.0% | -7.9% | -9.3% | -14.8% |
| Sub-Compact Crossover | 0.1% | -1.7% | -10.8% | -12.8% | -21.8% |
| Sub-Compact Luxury CUV | -3.0% | -1.7% | -10.8% | -12.5% | -24.7% |
3. Impact of Electric Vehicles on Depreciation
Electric vehicles (EVs) are becoming increasingly prevalent, but they bring unique challenges and opportunities regarding depreciation.
Growth of EVs
The growth of EVs has been significant, driven by technological advancements, environmental concerns, and government incentives. However, this rapid growth has led to some market imbalances, affecting depreciation rates.
Challenges and Opportunities
EVs often face higher initial depreciation due to several factors, including high upfront costs, rapidly evolving technology, and concerns about battery life and range. However, as the technology matures and market acceptance grows, the depreciation rates of EVs are expected to stabilize.
4. The Role of Leasing in Vehicle Depreciation
Leasing has become an increasingly popular option for consumers, and it plays a significant role in vehicle depreciation trends.
Leasing Trends
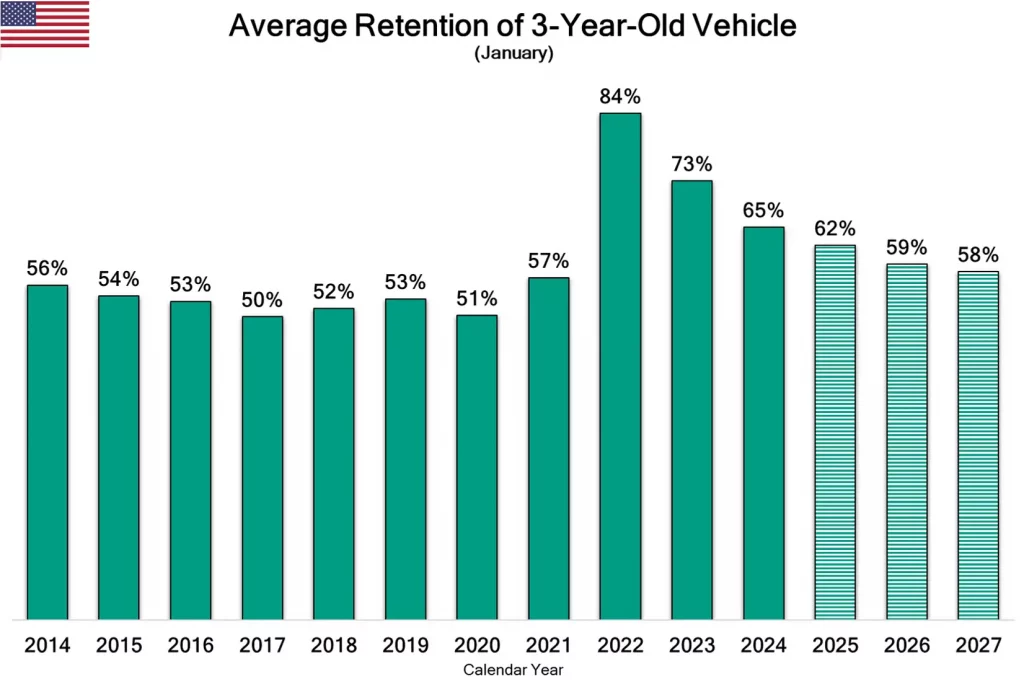
The 2024 report indicates a resurgence in leasing, driven by increased incentives and the growth of EV sales. Leasing can influence depreciation rates, as leased vehicles often return to the market after a few years, affecting supply and demand dynamics.
Lease vs. Buy
When comparing leasing and buying, it’s essential to consider how each option affects vehicle depreciation. Leasing typically involves lower monthly payments and allows consumers to drive newer models more frequently, which can mitigate the impact of depreciation.
Table: Leasing vs. Buying Depreciation Impact
| Factor | Leasing | Buying |
|---|---|---|
| Monthly Payments | Lower | Higher |
| Vehicle Upgrades | Frequent | Infrequent |
| Depreciation Risk | Less (to consumer) | More (to owner) |
5. Seasonal Patterns in Vehicle Depreciation
Vehicle depreciation rates can fluctuate throughout the year, influenced by seasonal patterns and market dynamics.
Overview of Seasonal Fluctuations
The 2024 report highlights how depreciation rates vary across different seasons. Typically, the market sees appreciation in early spring, followed by increased depreciation in the latter half of the year.
Key Periods
Understanding these patterns can help consumers make better purchasing decisions. For example, buying a vehicle during periods of high depreciation might result in a better deal, as prices are lower.
Table: Seasonal Depreciation Patterns
| Season | Depreciation Rate (%) |
|---|---|
| Spring | +0.6 |
| Summer | -5.0 |
| Fall | -9.8 |
| Winter | -11.8 |
6. Regional Variations in Vehicle Depreciation
Depreciation rates can also vary significantly across different regions, influenced by local economic conditions, weather, and market preferences.
Regional Differences
The 2024 report provides insights into how vehicle depreciation varies by region. For instance, vehicles in areas with harsh weather conditions or high salt usage on roads might depreciate faster due to increased wear and tear.
Factors Driving Regional Differences
Local economic conditions, such as employment rates and regional industry presence, also play a role. Areas with robust economic growth and high demand for vehicles typically see lower depreciation rates.
Table: Regional Depreciation Data
| Region | Depreciation Rate (%) |
|---|---|
| Northeast | 22 |
| Midwest | 20 |
| South | 18 |
| West | 17 |
7. Strategies to Mitigate Vehicle Depreciation
While vehicle depreciation is inevitable, there are strategies that consumers can employ to minimize its impact.
Practical Tips for Consumers
Maintaining your vehicle in good condition, avoiding unnecessary mileage, and keeping up with regular maintenance can help preserve its value. Choosing vehicles known for their reliability and resale value is also a wise strategy.
Best Practices
Other best practices include considering leasing options, timing your purchase to align with favorable market conditions, and staying informed about market trends and depreciation rates.
Table: Tips for Reducing Depreciation
| Strategy | Description |
|---|---|
| Regular Maintenance | Keep the vehicle in good condition |
| Low Mileage | Avoid excessive driving |
| Choosing Reliable Models | Select vehicles with good resale value |
| Considering Leasing | Lease to mitigate depreciation impact |
| Timing Purchases | Buy during periods of high depreciation |
Conclusion
The 2024 vehicle depreciation report provides valuable insights into the factors influencing vehicle depreciation this year. By understanding these trends and employing strategies to mitigate depreciation, consumers and industry stakeholders can make more informed decisions. Staying informed about market dynamics, economic conditions, and regional variations will be crucial in navigating the complex landscape of vehicle depreciation in 2024.
By following these guidelines and staying up-to-date with the latest trends, you can better manage your vehicle’s value and make smarter financial decisions. Whether you’re considering buying, leasing, or selling a vehicle, understanding depreciation is key to maximizing your investment and minimizing losses.

