USED-VEHICLES SALES SUMMARY – 2009 STATS
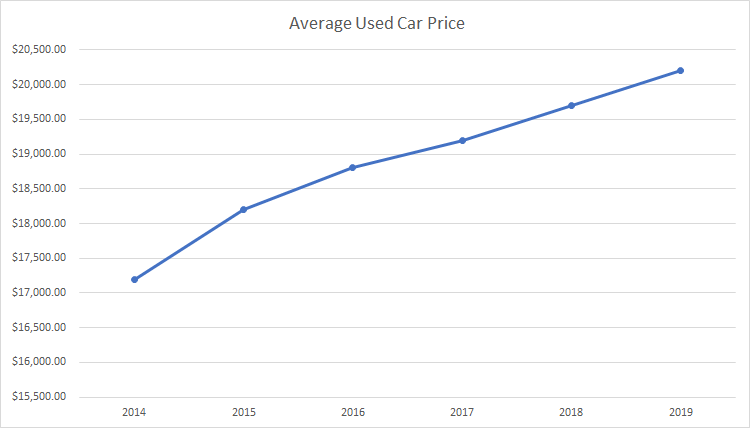
- The average used car is $20,200
- Day Supply down an average of 4.8% since 2014
- Average used car sold has 51,349
- Average used car sold is 4.3 years old
- More SUV’s are sold than Cars
- Used car sales increased 3% more than new cars
USED-VEHICLES SALES SUMMARY – VOLUME
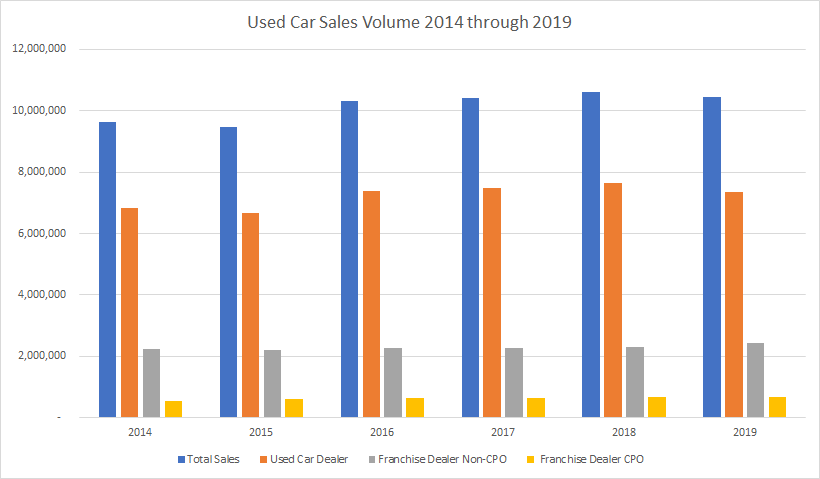
| Year | Total Sales | Used Car Dealer | Franchise Dealer Non-CPO | Franchise Dealer CPO |
| 2014 | 9,623,024 | 6,839,570 | 2,231,647 | 551,807 |
| 2015 | 9,482,306 | 6,662,664 | 2,204,630 | 615,012 |
| 2016 | 10,322,931 | 7,395,160 | 2,281,381 | 646,390 |
| 2017 | 10,407,210 | 7,488,836 | 2,271,036 | 647,338 |
| 2018 | 10,617,195 | 7,651,706 | 2,291,192 | 674,297 |
| 2019 | 10,452,599 | 7,340,665 | 2,434,727 | 677,207 |
USED-VEHICLES SALES SUMMARY – PRICE
| Year | Avg Price |
| 2014 | $ 17,200.00 |
| 2015 | $ 18,200.00 |
| 2016 | $ 18,800.00 |
| 2017 | $ 19,200.00 |
| 2018 | $ 19,700.00 |
| 2019 | $ 20,200.00 |
