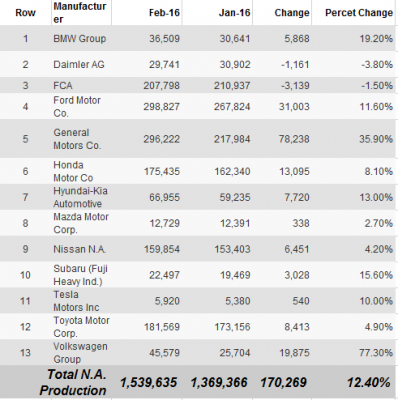
Automotive US Production Report for February 2016

| Row | Manufacturer | Feb-16 | Jan-16 | Change | Percet Change |
| 1 | BMW Group | 36,509 | 30,641 | 5,868 | 19.20% |
| 2 | Daimler AG | 29,741 | 30,902 | -1,161 | -3.80% |
| 3 | FCA | 207,798 | 210,937 | -3,139 | -1.50% |
| 4 | Ford Motor Co. | 298,827 | 267,824 | 31,003 | 11.60% |
| 5 | General Motors Co. | 296,222 | 217,984 | 78,238 | 35.90% |
| 6 | Honda Motor Co | 175,435 | 162,340 | 13,095 | 8.10% |
| 7 | Hyundai-Kia Automotive | 66,955 | 59,235 | 7,720 | 13.00% |
| 8 | Mazda Motor Corp. | 12,729 | 12,391 | 338 | 2.70% |
| 9 | Nissan N.A. | 159,854 | 153,403 | 6,451 | 4.20% |
| 10 | Subaru (Fuji Heavy Ind.) | 22,497 | 19,469 | 3,028 | 15.60% |
| 11 | Tesla Motors Inc | 5,920 | 5,380 | 540 | 10.00% |
| 12 | Toyota Motor Corp. | 181,569 | 173,156 | 8,413 | 4.90% |
| 13 | Volkswagen Group | 45,579 | 25,704 | 19,875 | 77.30% |
| Total N.A. Production | 1,539,635 | 1,369,366 | 170,269 | 12.40% | |


